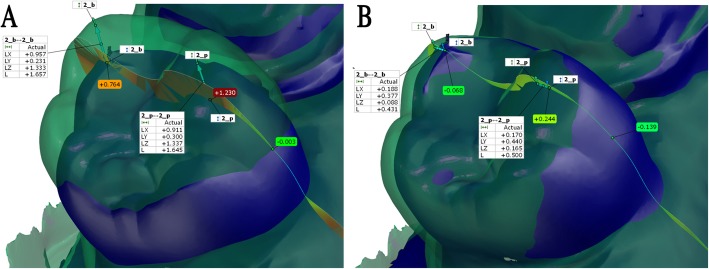
Fig. 5.
The cross-section through the two reference points of the terminal tooth (#2) in the case of local best fit at scanning origin (tooth 15) (a) and in the case of full arch alignment (b). The two double arrows (jade color) connects the two identical points between reference scan (blue) and test scan (transparent green, made by Planscan) in the 3D. The 3D distances (L) are shown in the attached tables. The colorful vectors in the cross-section, indicating the magnitude of the surface comparison values. Labels with color background show that surface deviation values at the points (2_b and 2_p) on the reference scan are considerably lower than the distances between identical points (L values). Furthermore, at the crossing point of the two surfaces (the label on the palatal site), it tends to zero. Multiple crossing points through the arch decrease the overall surface deviation value

