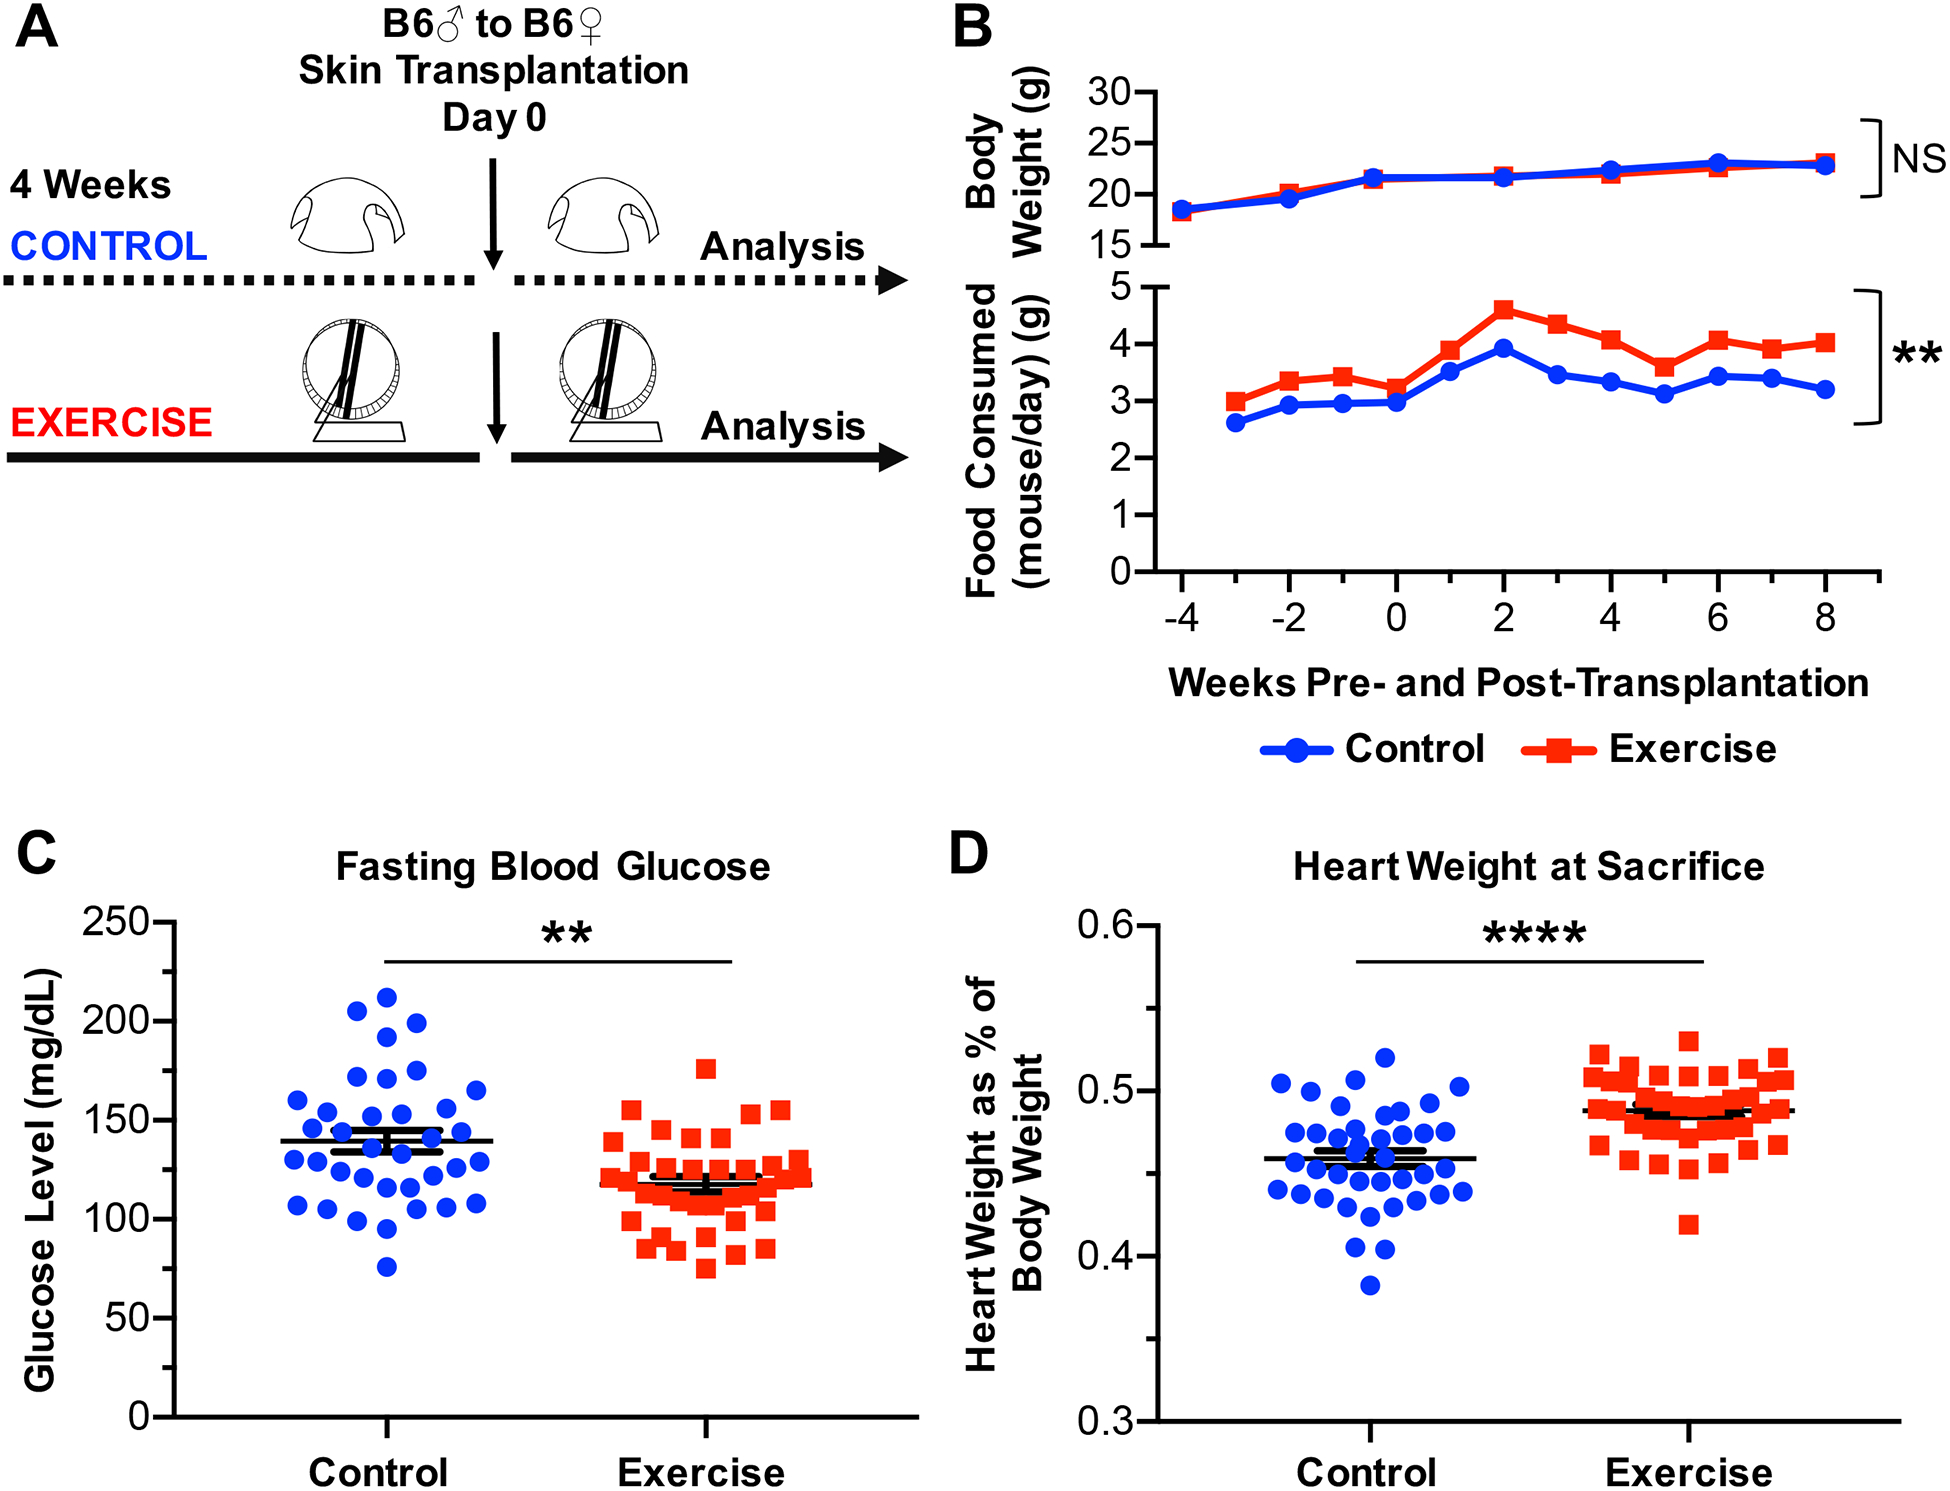
Figure 1. Model of voluntary exercise in female B6 mice.

(A) Experimental design. (B) Average body weight of female B6 control (n=11) or exercised (n=10) mice, and average food consumed per mouse per day for female B6 control (n=11) or exercised (n=10) mice, recorded over experimental time. (C) Fasting blood glucose levels of female B6 control (n=36) or exercised (n=37) mice, following 3.5 weeks of habitation in control or exercised cages. (D) Heart weight as percent of body weight upon sacrifice of female B6 control (n=40) or exercised (n=39) mice. (C-D) Each point represents a single mouse. Results are displayed as mean ± SEM. (B-D) Comparisons were performed using a two-tailed unpaired t test. **p<0.01, ****p<0.0001, NS = not significant. Results were combined from 4 independent experiments.
