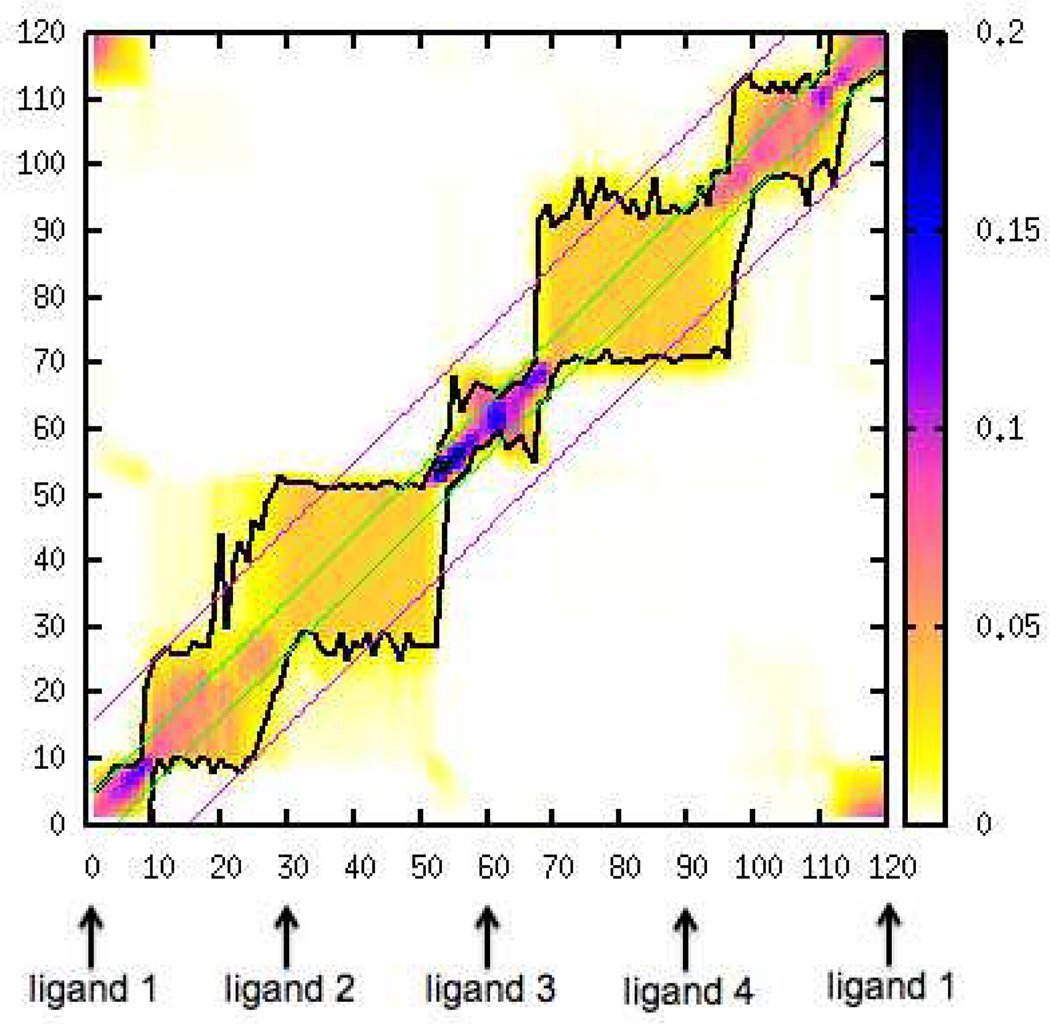
Figure 6:
Heat map of the overlapping state matrix. The black lines indicate the boundaries of 85% of the total contribution of the partition function of each diagonal state; the green lines indicate the neighborhood size of 4 for each state; the pink lines indicate the neighborhood size of 15 for each state. The raw data set obtained from state 61 shows the narrowest overlap with its neighbors; and the raw data set obtained from state 25 shows the widest overlap with its neighbors.

