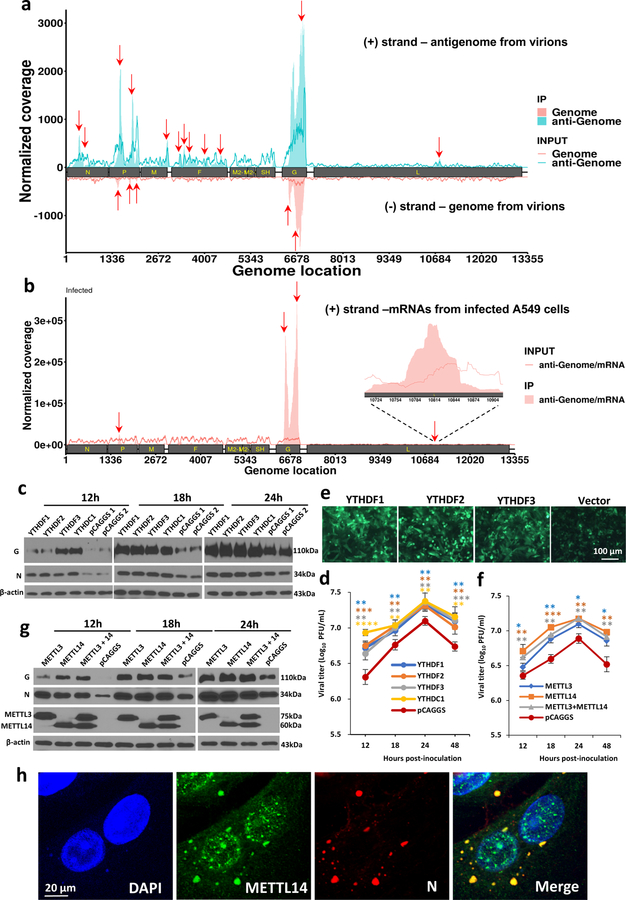
Fig. 1. The hMPV RNAs are m6A methylated and m6A methylation promotes hMPV replication.
(a) Distribution of m6A peaks in the hMPV antigenome and genome. A schematic diagram of the hMPV antigenome encoding 8 genes is shown. Total RNAs were extracted from purified rhMPV virions grown in A549 cells and were subjected to m6A immunoprecipitation followed by m6A-seq. Top panel: The m6A-seq of hMPV RNA showing the distribution of m6A-IP reads (blue block) mapped to the hMPV antigenome. The baseline signal from input samples is shown as a blue line. Lower panel: The distribution of m6A-IP reads (pink block) from m6A-seq mapped to the hMPV genome. The baseline signal from input samples is shown as a pink line. The red arrows indicate the m6A peaks. (b) Distribution of m6A peaks in the hMPV mRNAs. Polyadenylated mRNAs were isolated from hMPV-infected cells and subjected to m6A-seq. m6A reader (c) and writer (g) proteins enhance hMPV protein expression. A549 cells were transfected with plasmids encoding reader (c) or writer (g) genes. At 24 h, cells were infected with rhMPV at an MOI of 5.0. Total cell extracts were analyzed by Western blot. m6A reader (d) and writer (f) proteins increase hMPV progeny virus production. The release of infectious hMPV particles was monitored by a single-step growth curve. (e) YTHDF1, 2, 3 enhance GFP expression in rghMPV-infected cells. HeLa cells stably overexpressing YTHDF proteins were infected with rghMPV at an MOI of 1.0, and GFP expression was monitored at 48 h post-infection. (h) Strong co-localization of METTL14 with hMPV N protein. A549 cells were infected by rhMPV at an MOI of 5.0. At 24 h, cells were stained with anti-METTL14 antibody (green) and anti-hMPV N antibody (red), and analyzed by confocal microscope. Nuclei were labeled with DAPI (blue). The results of n = 2 (a-b), n = 3 (c, e-h), or n = 4 (d) biologically independent experiments are shown (representative immunoblots (c, g) and images (e, h) are shown). Data (a and b) are the average results from two samples (n = 2). Viral titers are the geometric mean titers (GMT) ± standard deviation. Statistical significance was determined by two-sided student’s t-test. Exact P values are included in Data Source. *P<0.05, **P<0.01, and ***P<0.001.

