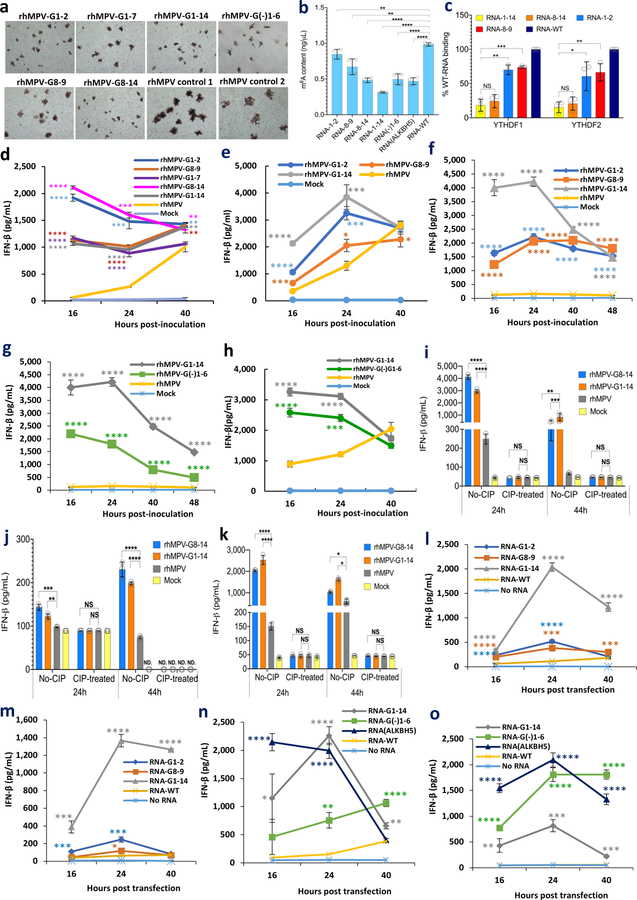
Fig. 2. m6A-deficient rhMPVs and their virion RNAs induce higher type I IFN responses.
(a) Immunostaining spots formed by rhMPVs. (b) Quantification of m6A level. Total m6A level of each virion RNA was quantified by m6A RNA Methylation Assay Kit. (c) m6A-deficient rhMPV RNA has reduced binding efficiency to reader proteins. Cell lysate containing HA-tagged YTHDF1 or YTHDF2 was incubated with virion RNA and anti-HA Magnetic beads. The amount of virion RNA captured by the YTHDF1 or YTHDF2 was quantified by real-time RT-PCR. Percent of bound RNA of hMPV mutants relative to rhMPV was calculated. IFN-β secretion in A549 cells infected by hMPV at MOI of 4.0 (d, h) or an MOI of 1.0 (e). A549 cells were infected with each rhMPV at an MOI of 4.0, and IFN-β in cell supernatants were measured by ELISA. Dynamics of IFN-β secretion in THP-1 cells infected by hMPV at an MOI of 4.0 (f-g). (i) IFN-β response in A549 cells transfected with total RNA. Total RNA was extracted from hMPV-infected A549 cells, and the antigenome was quantified by real-time RT-PCR. A549 cells were transfected with 108 antigenome RNA copies of total RNA with or without treatment CIP. IFN-β was measured by ELISA. (j) IFN-β response in A549 cells transfected with viral G mRNA. A549 cells were transfected with 109 RNA copies of G mRNA either with or without CIP treatment. (k) IFN-β response in A549 cells transfected with virion RNA. A549 cells were transfected with 2×10⁷ antigenome copies of virion RNA either with or without CIP treatment. (l and m) Comparison of IFN response of virion RNA of rhMPV-G1-14, G1-2, G8-9, and rhMPV. A549 cells were transfected with 107 (l) or 106 (m) RNA copies of virion RNA. (n and o) Natural m6A-deficient virion RNA induces IFN response. A549 cells were transfected with 107 (n) or 106 (o) RNA copies of virion RNA of rhMPV-G1-14, G(-)1-6, ALKBH5, and rhMPV. Immunospots (a) shown are the representatives of n = 3 biologically independent experiments. Data shown are means of n = 3 (c-o) or n = 4 (b) biologically independent experiments ± standard deviation. Statistical significance was determined by two-sided student’s t-test. Exact P values are included in Data Source. *P<0.05; **P<0.01; ***P<0.001; ****P<0.0001, NS, no significant.

