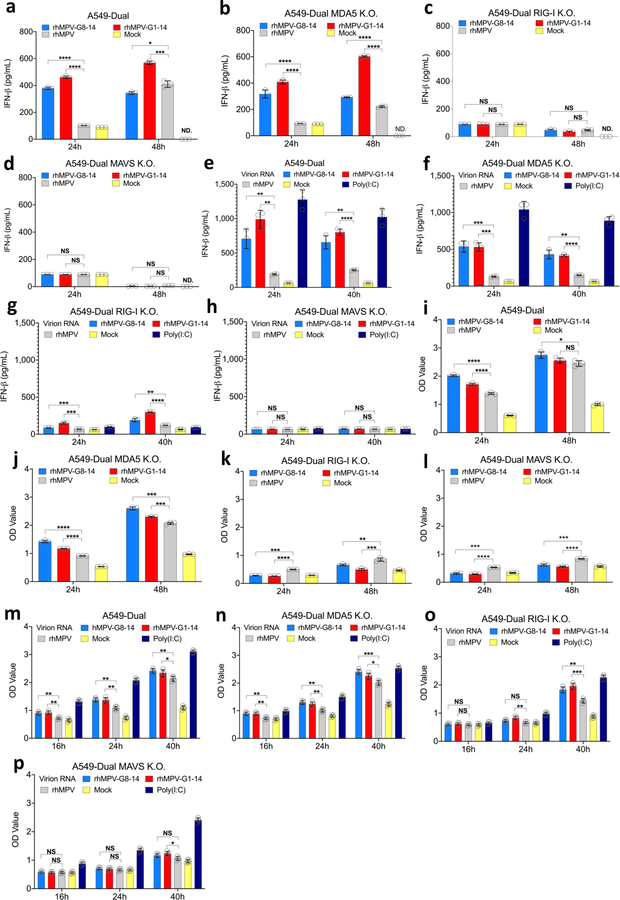
Fig. 3. IFN response and NF-κB activation in A549 cells infected with m6A deficient hMPVs or transfected with m6A deficient virion RNA.
Confluent WT (a), MDA5 (b), RIG-I (c), or MAVS (d)-knockout A549 cells were infected by rhMPV, rhMPV-G8-14, or rhMPV-G1-14 at an MOI of 1.0, cell culture supernatants were harvested at 24 and 48 h post-inoculation. IFN-β in cell supernatants was measured by ELISA. Confluent wild-type (e), MDA5 (f), RIG-I (g), or MAVs (h)-knockout A549 cells were transfected with 107 antigenomic RNA copies of virion RNA of rhMPV, rhMPV-G8-14, rhMPV-G1-14 or 2 μg poly(I:C), cell culture supernatants were harvested at 24 and 40 h post-inoculation. IFN-β in cell supernatants was measured by ELISA. Confluent WT (i), MDA5 (j), RIG-I (k), or MAVs (l)-knockout A549 cells were infected by rhMPV, rhMPV-G8-14, or rhMPV-G1-14 at an MOI of 1.0, cell culture supernatants were harvested at 24 and 48 h post-inoculation. These A549 cells also express a secreted embryonic alkaline phosphatase (SEAP) reporter gene under the control of the IFN-β minimal promoter fused to five NF-κB binding sites, allowing us to measure the activation of the NF-κB pathway. SEAP secreted in cell supernatants was measured by colorimetric enzyme assay with substrate Quanti-Blue™ and read by microplate reader on OD value at 620nm. Confluent WT (m), MDA5 (n), RIG-I (o), or MAVs (p)-knockout A549 cells were transfected with 107 antigenomic RNA copies of virion RNA of rhMPV, rhMPV-G8-14, rhMPVG1-14 or 2 μg poly(I:C) with or without CIP treatment, cell culture supernatants were harvested at 16, 24, and 40 h post-inoculation. SEAP secretion in cell supernatants was measured. Data shown (a-l) are means of n =3 or n = 4 (m-p) biologically independent experiments ± standard deviation. All data of rhMPV-G8-14 and rhMPV-G1-14 were compared to those of rhMPV. Statistical significance was determined by two-sided student’s t-test. Exact P values are included in Data Source. *P<0.05; **P<0.01; ***P<0.001; ****P<0.0001.

