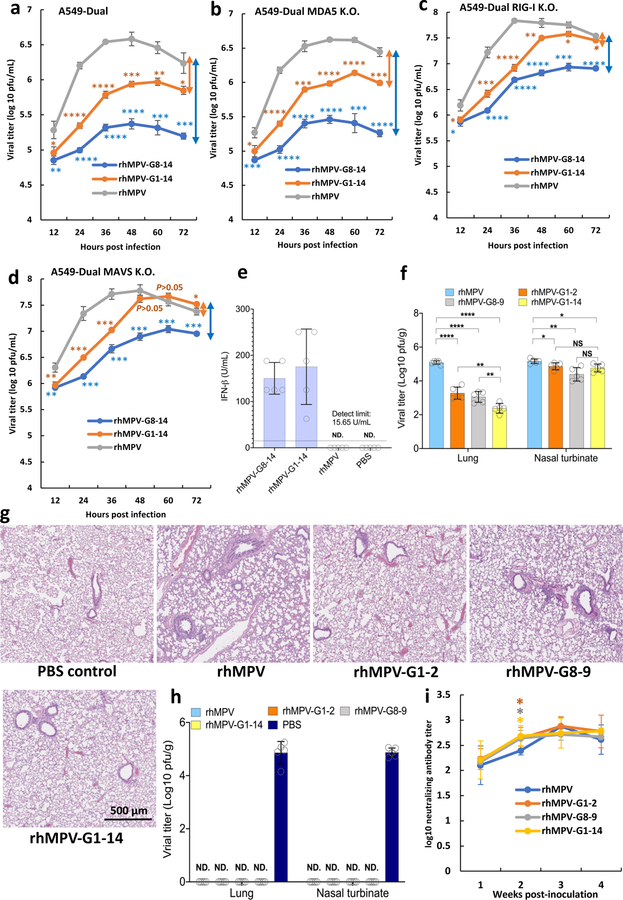
Fig. 6. Replication, interferon response, pathogenicity, and immunogenicity of m6A-deficient rhMPVs. Replication Kinetics of m6A deficient rhMPVs in WT.
(a), MDA5 (b), RIG-I (c), or MAVS (d)-knockout A549 cells. Cells in 24-well plates were infected by each hMPV at an MOI of 1.0, and viral growth curve was determined. The arrows indicate the degree of titer difference compared to rhMPV. (e) Interferon response of rhMPV in cotton rats. Six-week-old SPF female cotton rats (n = 5) were inoculated intranasally with 100 µl of PBS or 2.0×10⁵ p.f.u. of rhMPV-G8-14, rhMPV-G1-14 or rhMPV. At 48 h post-inoculation, cotton rats were sacrificed. BAL from the right lung was collected for IFN-β bioactivity assay. (f) hMPV titer in lungs and nasal turbinates. Six-week-old SPF cotton rats (n = 5) were inoculated intranasally with 2.0×10⁵ p.f.u. of each rhMPV. At day 4 post-infection, lungs and nasal turbinates were collected for virus titration. (g) m6A deficient rhMPVs had less lung histopathological changes compared to rhMPV. Representative pathological changes from each group are shown. Micrographs with original magnification, ×20 are shown. The parental hMPV caused moderate interstitial pneumonia, mononuclear cell infiltration. In contrast, fewer histological changes were found in the lungs of cotton rats infected with m6A-deficient rhMPVs. (h) m6A deficient rhMPV provides complete protection against hMPV challenge. Four-week-old SPF cotton rats (n = 5) were inoculated intranasally with 2.0×10⁵ p.f.u. of each rhMPV. At week 4 post-immunization, cotton rats were challenged with 2.0×10⁵ p.f.u. of hMPV. At day 4 post-challenge, the cotton rats were sacrificed, lungs and nasal turbinates were collected for virus titration by an immunostaining plaque assay. (i) m6A deficient rhMPV induced a high level of neutralizing antibody. Blood samples were collected from each rat weekly by retro-orbital bleeding. The hMPV-neutralizing antibody titer was determined using a plaque reduction neutralization assay. Viral titers (a-d) are the geometric mean titers (GMT) of n = 3 biologically independent experiments ± standard deviation. Viral titers (f and h) and antibody titers (i) are the geometric mean titers (GMT) of five cotton rats (n = 5) ± standard deviation. Detection limit is 2.0 log [p.f.u.] per g tissue. Statistical significance was determined by two-sided student’s t-test. Exact P values are included in Data Source. *P<0.05; **P<0.01; ***P<0.001; ****P<0.0001.

