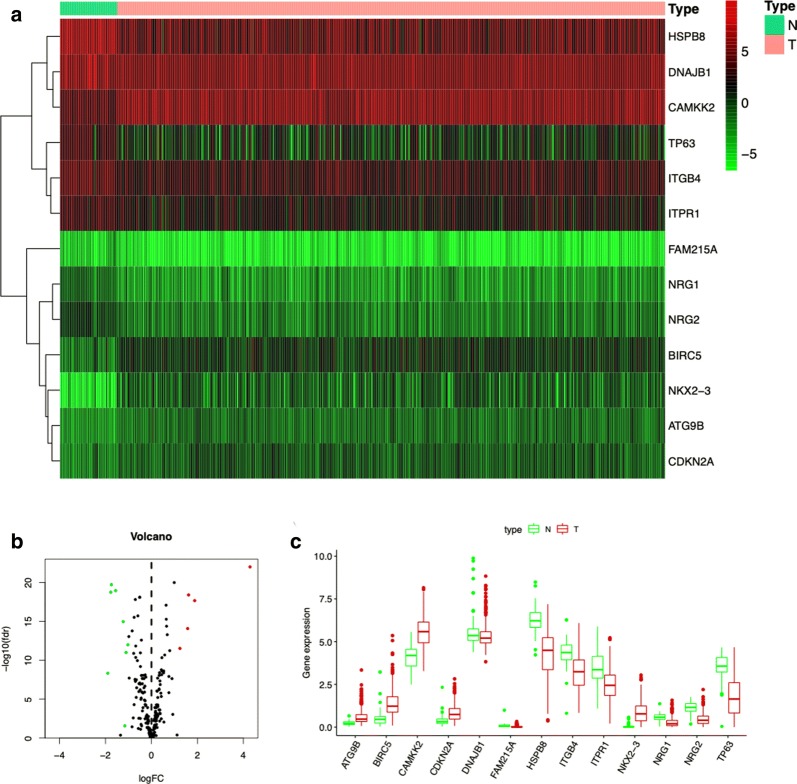
Fig. 1.
Differentially expressed ARGs between prostate cancer and normal prostate tissues. a Heatmap of differentially expressed ARGs. b The volcano plot for the 234 ARGs from the TCGA data portal. Red indicates high expression, and green indicates low expression. Black shows that those genes showed no difference between prostate cancer and normal prostate tissues. c The expression patterns of 13 differentially expressed ARGs in prostate cancer and paired non-tumor samples. Red and green indicate tumor tissues and normal tissues, respectively

