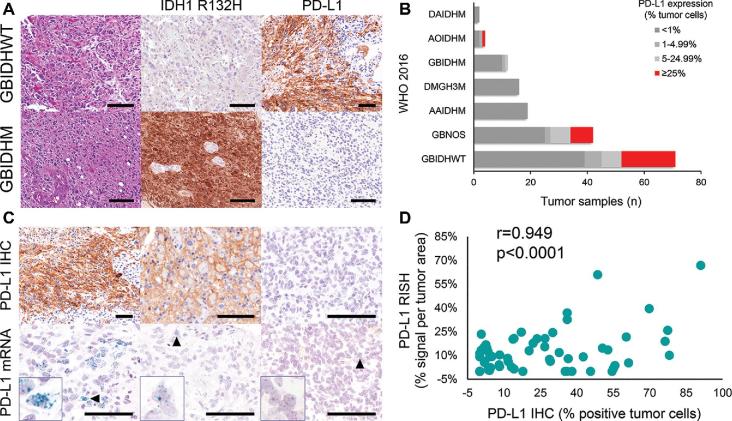
FIGURE 2.
PD-L1 IHC across 2016 WHO histomolecular subtypes and RISH correlation. A, Representative images of IDH-wildtype (GBIDHWT) and IDH-mutant (GBIDHM) glioblastoma stained with anti-PD-L1 (SP263). B, Stacked bar chart showing PD-L1 IHC distributed across WHO 2016 diagnoses in the NIH cohort (n = 183). C, Overall, PD-L1 staining intensity (not quantified in the current study) was associated with an increase in PD-L1 RISH signals. D, Across the entire cohort (n = 183), quantitative PD-L1 IHC and mRNA showed a significant positive correlation. Scale bar = 100 μm.

