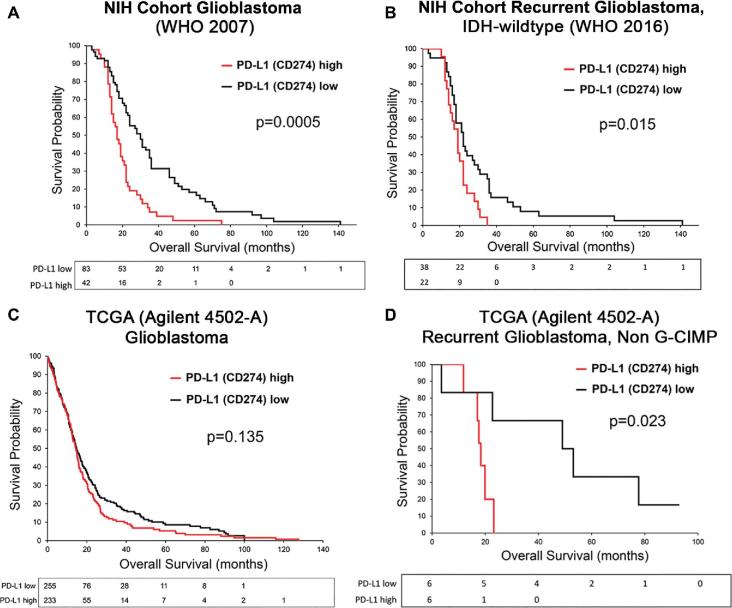
FIGURE 3.
Kaplan–Meier survival estimates comparing high and low PD-L1 expression in glioblastoma. A, Differences in survival curves from tumors meeting the 2007 WHO histologic criteria for glioblastoma (5% PD-L1 cut-off). B, Differences in survival curves from recurrent IDH-wildtype glioblastoma reclassified according to the 2016 WHO nomenclature (5% PD-L1 cut-off). C, TCGA survival curves, classified only as glioblastoma, stratified by median PD-L1 mRNA expression. D, Survival curves from TCGA patients after filtering for recurrent, non–G-CIMP (IDH-wildtype) tumors (median PD-L1 mRNA cut-off).

