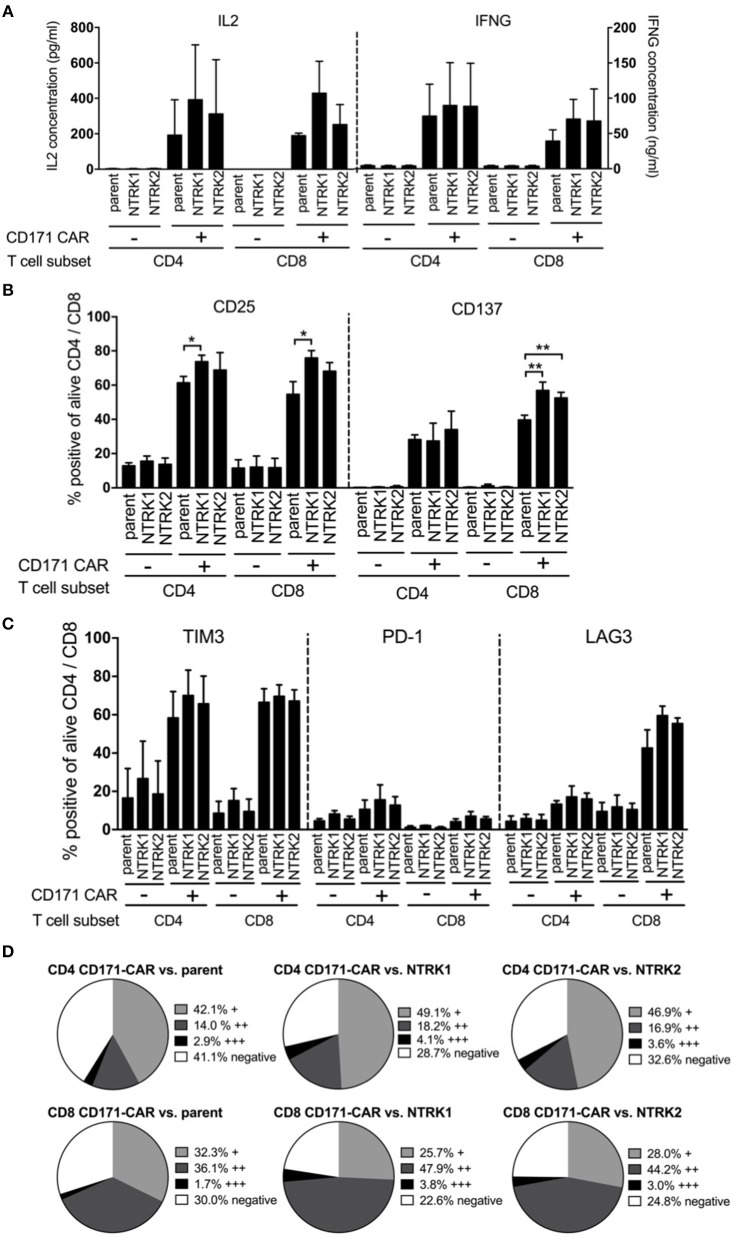
Figure 4.
SH-SY5Y-NTRK1 expression results in increased CAR T cell activity, whereas NTRK has no significant influence on cytokine production and expression of exhaustion markers in CAR T cells. (A) Concentration of cytokines IL2 and IFNG in supernatant of CAR T cell and tumor in an effector:target ratio of 1:2 after 24 h co-culture determined by sandwich ELISA. Flow cytometric analysis of T cell surface activation markers CD25 and CD137 on CAR and control T cells after 24 h tumor co-culture. Depicted are double positive CAR and control T cells for CD4+ or CD8+ and CD25 or CD137. Cells were gated from living single cells. (B) Flow cytometric analysis of surface activation markers: Proportion of CD25 and CD137 on CAR T cells after tumor co-culture for 24 h in an effector:target ratio of 1:1 are shown. Depicted are double-positive cells for CD4+ or CD8+ and CD25 or CD137. Cells were gated from living single cells. Flow cytometric analysis was conducted in three independent experiments. (C) Flow cytometric analysis of surface exhaustion markers: Proportion of TIM3, PD-1, and LAG3 on CAR T cells after tumor co-culture for 24 h in an effector:target ratio of 1:1. Depicted are double-positive cells for CD4+ or CD8+ and TIM3, PD-1, or LAG3. Cells were gated from living single cells. Flow cytometric analysis was conducted in three independent experiments. (D) Distribution of no, single (+), double (++), or triple (+ + +) expression of exhaustion markers on CD4+ and CD8+ CAR T cells after 24 h tumor co-culture in an effector:target ratio of 1:1. Single positivity (+) was defined as the sum of TIM3+/PD-1−/LAG3−, TIM3−/PD-1+/LAG3− populations and TIM3−/PD-1−/LAG3+ populations. Double positivity (++) was defined as the sum of TIM3+/PD-1−/LAG3+ populations, TIM3+/PD-1+/LAG3− populations and TIM3−/PD-1+/LAG3+ populations. Triple positivity (+ + +) was defined as TIM3+/PD-1+/LAG3+ populations. Negative expression was defined as TIM3−/PD-1−/LAG3− populations. Bars showed mean values with error bars representing SD. *p < 0.05; **p < 0.01.

