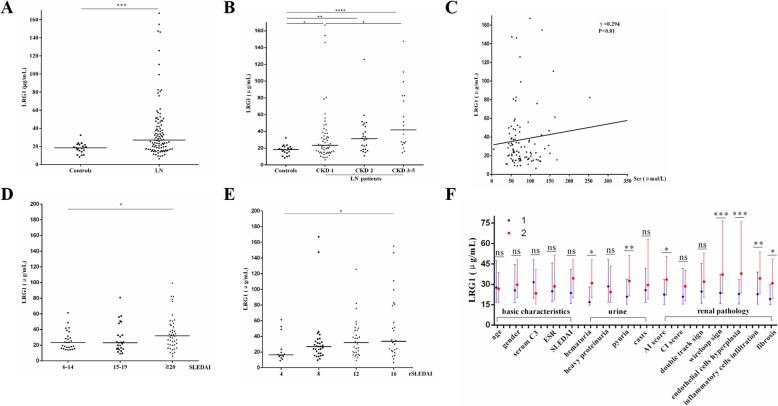
Fig. 1.
Plasma leucine-rich alpha-2 glycoprotein 1 (LRG1) levels in lupus nephritis (LN) patients and its correlation to indicators. a Plasma LRG1 levels in LN patients and healthy controls. b Differences in plasma concentrations of LRG1 between different patients with different CKD grades. c Plasma levels of LRG1 are positively correlated with serum creatinine (γ = 0.294, P < 0.01). d, e Differences in plasma concentrations of LRG1 between different patients with different SLE activity grade (SLEDAI) and renal SLEDAI (rSLEDAI). f Differences in plasma concentrations of LRG1 between different patients with other different clinical and pathological indicators, 1 and 2 are representative < and ≥ median: 29.0 years for age, 5.0 AI score, 4.0 CI score, 0.4 for complement 3 (C3); female and male for gender; < and ≥ 20 for SLEDAI;<20 and ≥ 20 mm/h for erythrocyte sedimentation rate (ESR); − and + for hematuria, heavy proteinuria, pyuria, casts, double track sign, wireloop sign, endothelial cells hyperplasia and fibrosis; light and heavy for inflammatory cell infiltration. Symbols represent individual data points with the median as a horizontal line in Fig. 1a, b, d and e. Data are presented as bar graphs with the median and 25–75th percentile of the plasma LRG1 concentrations in Fig. 1f (ns, not significant; *P < 0.05; **P < 0.01; ***P < 0.001; ****P < 0.0001)

