FIGURE 2.
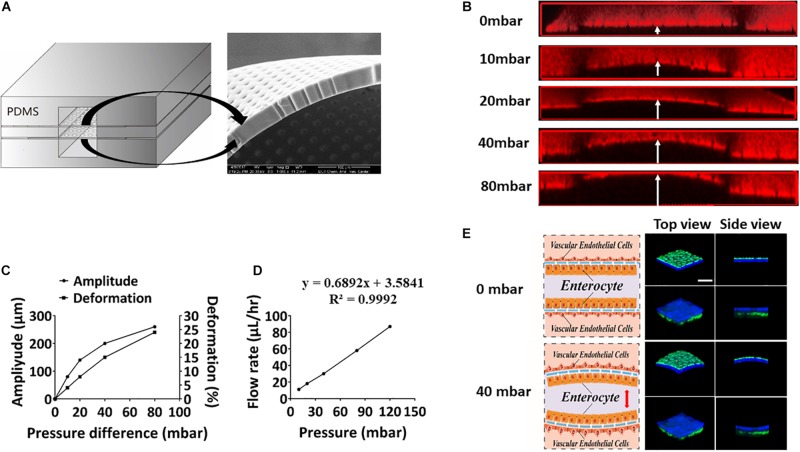
Evaluation of peristaltic effect in the microsystem. (A) A cross-sectional view of the porous membrane on the microfluidic chip (left), and scanning electron micrograph showing a side view of a portion of the porous membrane (right). (B) Laser confocal layer scanning diagram of the deformation of the PDMS porous membrane on the microfluidic device under different fluid pressure differences. Red rhodamine solution was flowed through the middle layer of the chip, and colorless deionized water was flowed through the upper and lower layers. (C) Quantitation of the amplitude produced in the ECM-coated, flexible, porous PDMS membrane and deformation produced in the adherent intestinal epithelial cells under different fluid pressure differences. (D) Quantitative relationship between the fluid flow rate and the air pressure on the microsystem. (E) Schematics (left) and laser confocal layer scanning diagrams (right) of the deformation of the intestinal epithelial layer (blue) and vascular endothelium (green) adhering to the porous membrane cultured within the gut-vessel microfluidic chip at fluid pressure differences of 0 and 40 mbar (bar, 50 μm).

