FIGURE 7.
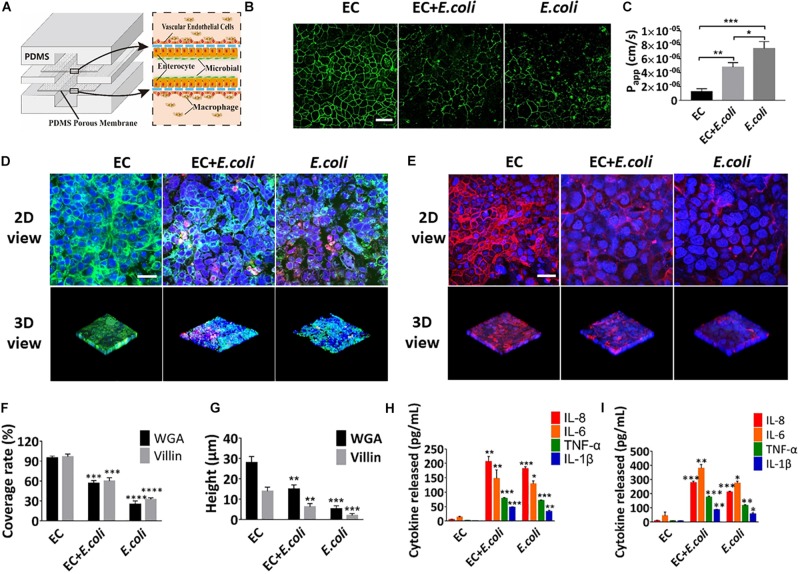
Intestinal damage and inflammatory responses caused by E. coli on the chip. (A) Conceptual diagram of the microsystem of human inflammatory bowel disease representing co-culture of vascular endothelial cells, enterocyte, macrophages with enterobacteria. (B) The confocal fluorescence views showing the distribution of the tight junction protein – occludin (green) in the epithelial monolayers cultured in the peristaltic human gut-vessel microsystem under control conditions (EC) versus presence of E. coli with (EC + E. coli) or without (E. coli) endothelial cells for 24 h (bar, 50 μm). (C) Quantification of Papp measured by quantitating fluorescent dextran transport across intestinal epithelial layer under the conditions as described in (B) (n = 3; *P < 0.05, **p < 0.01, ***P < 0.001). (D) Confocal immunofluorescence views of the sugar chain portion (FITC-WGA, green) of the glycocalyx layer secreted by the Caco2 cells cultured under the conditions described in (B) (nuclei in blue, E. coli in red) (bar, 50 μm). (E) Confocal immunofluorescence views of the villin of the microvilli secreted by the Caco2 cells cultured under the conditions described in (B) (nuclei in blue, villin in red) (bar, 50 μm). Computerized quantification of the coverage (F) and height (G) of the sugar chain portion and villin measured under the conditions described in (B) (n = 3; **p < 0.01, ***P < 0.001, ****P < 0.0001). Polarized secretion of proinflammatory cytokines (IL-8, IL-6, TNF-α, and IL-1β) in the enteric cavity (H) and vessel lumen (I) under the conditions described in (B) (n = 3; *P < 0.05, **p < 0.01, ***P < 0.001).

