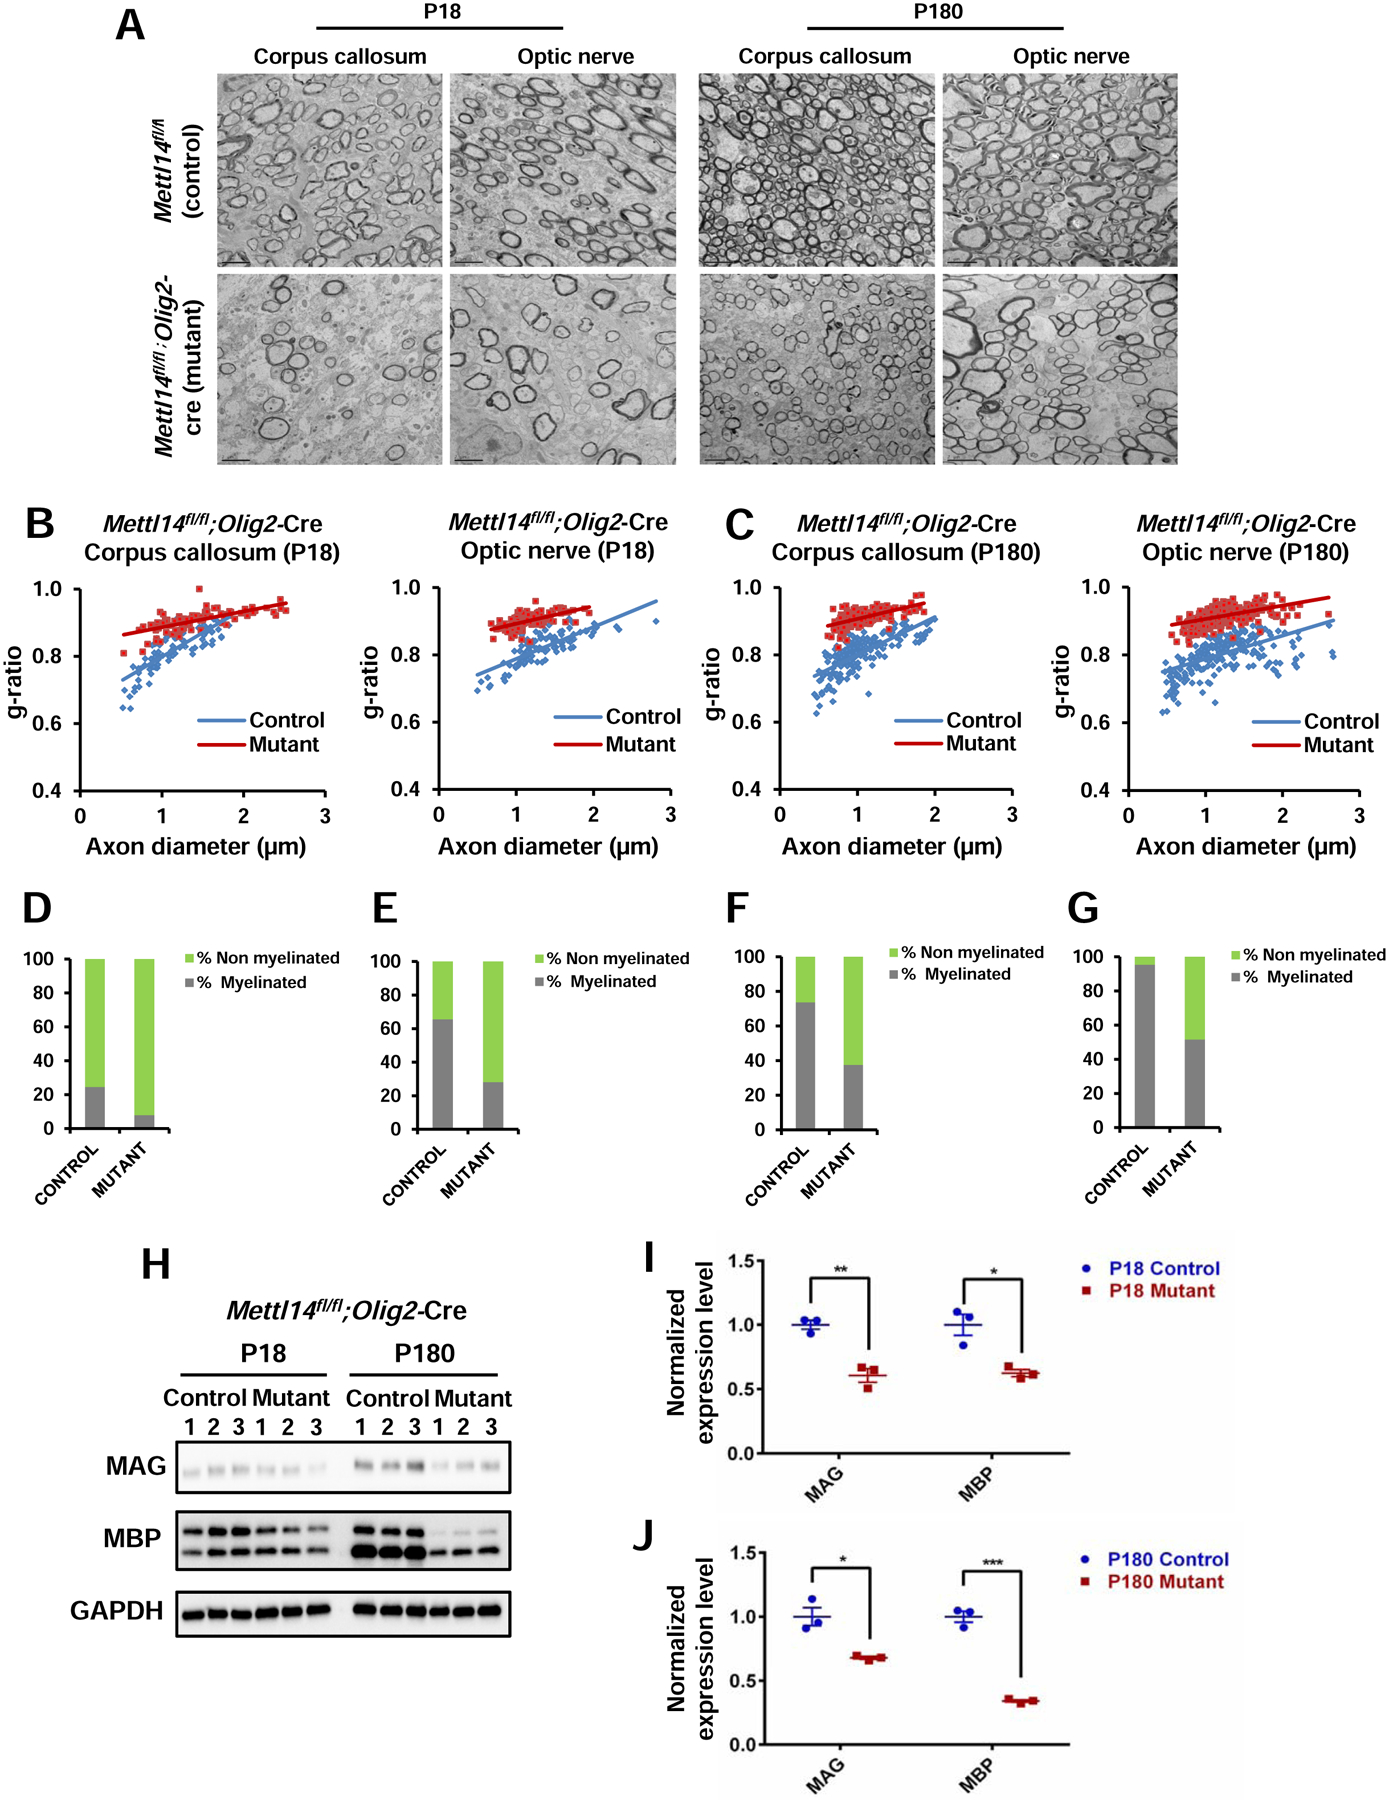
Figure 3. Mettl14 ablation leads to hypomyelination.

(A) Representative EM images of corpus callosum and optic nerve in P18 and P180 Mettl14fl/fl;Olig2-Cre control and mutant animals. Mutant corpus callosum and optic nerve had thinner myelin and fewer myelinated axons in both ages (Scale bar=2μm).
(B) g-ratio analyses showing significantly higher g-ratios in both P18 Mettl14fl/fl;Olig2-Cre mutant corpus callosum (Mutant g ratio=0.91, control g ratio=0.80) and optic nerve (mutant g ratio= 0.90, control g ratio= 0.82), (n=3; ***p<0.001; unpaired Student’s t test).
(C) g-ratio analyses showing significantly higher g-ratios in both P180 Mettl14fl/fl;Olig2-Cre mutant corpus callosum (Mutant g ratio=0.91, control g ratio=0.80) and optic nerve (mutant g ratio= 0.91, control g ratio= 0.83), (n=3; ***p<0.001; unpaired Student’s t test).
(D–G) Percentage of myelinated axons in corpus callosum and optic nerve (D. P18 Mettl14fl/fl;Olig2-Cre corpus callosum, E. P18 Mettl14fl/fl;Olig2-Cre optic nerve, F. P180 Mettl14fl/fl;Olig2-Cre corpus callosum, G. P180 Mettl14fl/fl;Olig2-Cre optic nerve). (n=3, ***p<0.001; unpaired Student’s t test).
(H) Western blot showing myelin protein expression (MAG, MBP) levels in both P18 and P180 Mettl14fl/fl;Olig2-Cre control and mutant animals (n=3).
(I–J) Quantification of immunoblots. MAG and MBP expression levels were normalized to GAPDH expression levels. Both MAG and MBP were significantly reduced in P18 (I) and P180 (J) Mettl14fl/fl;Olig2-Cre mutants. Values represent mean ± SEM (n=3; *p<0.05; **p<0.01; ***p<0.001; unpaired Student’s t test).
See also Figure S2.
