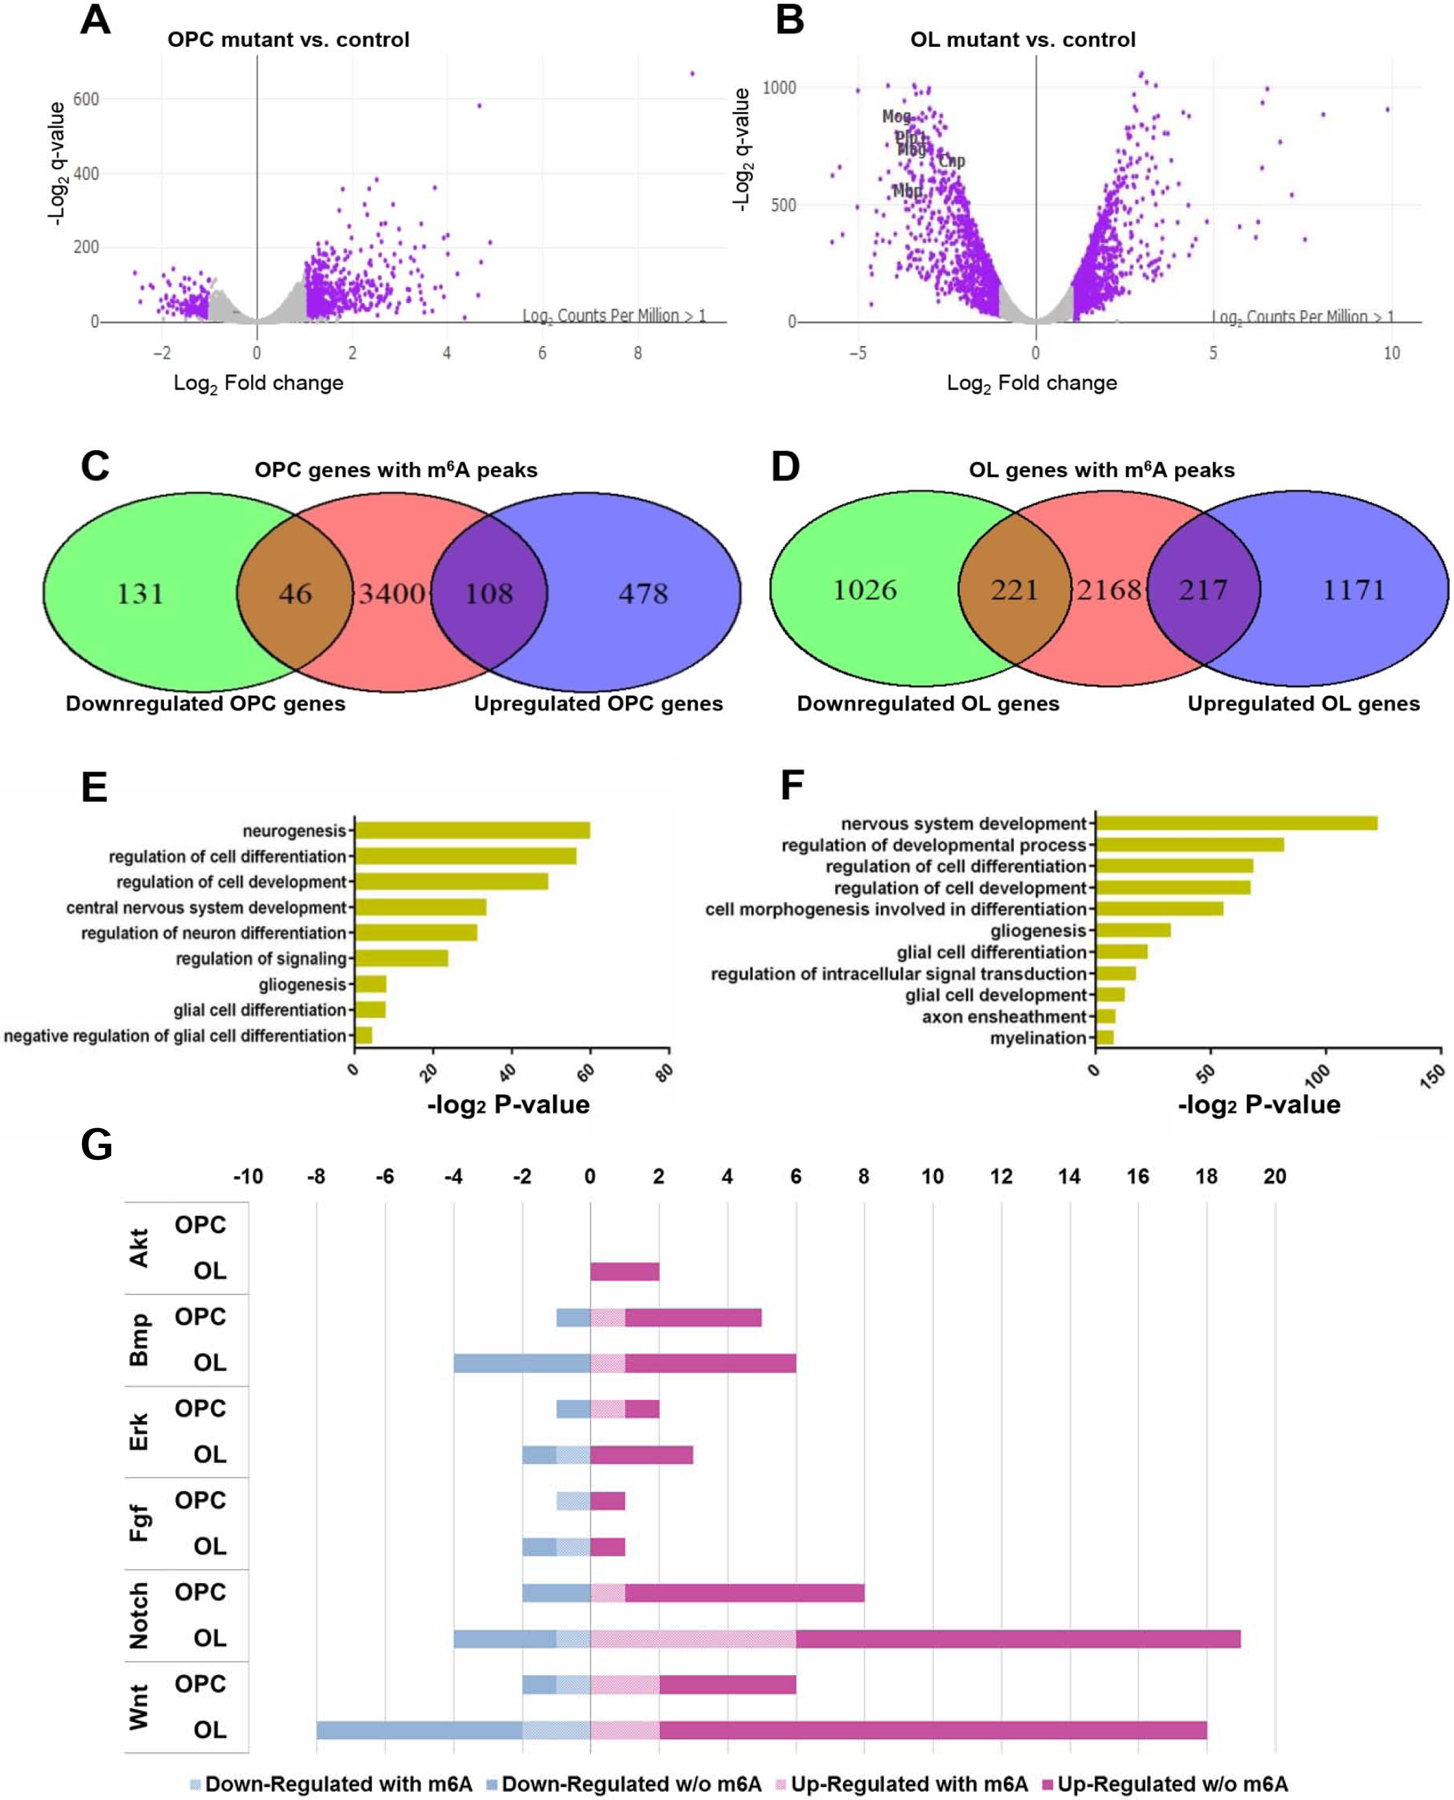
Figure 6. Mettl14 deletion differentially alters OL and OPC transcriptome.

(A–B) Volcano plots display the differentially expressed genes in the Mettl14fl/fl;Olig2-Cre OPCs (A) and oligodendrocytes (B) mutants versus controls (n=3). The highlighted genes (purple) are significantly (q-value<0.001, log2 |CPM|>1) regulated and have a notable fold change (log2 |FC|>1) in their expression in the mutants. Selected myelin genes are labeled.
(C–D) Venn diagram shows the numbers of significantly downregulated or upregulated OPC (C) and oligodendrocyte (OL) (D) transcripts that also have the m6A mark.
(E–F) The ontology categories of the m6A marked transcripts that are significantly altered in the OPCs (E) and oligodendrocytes (F). (log2 |FC|>1, log2 |CPM|>1, q-value <0.001, Z-score>0).
(G) Bar graph shows the number of m6A marked transcripts in the selected altered signaling pathways in OPCs and oligodendrocytes. (log2 |FC|>1, log2 |CPM|>1, q-value<0.001, Z-score>0).
