Figure 3.
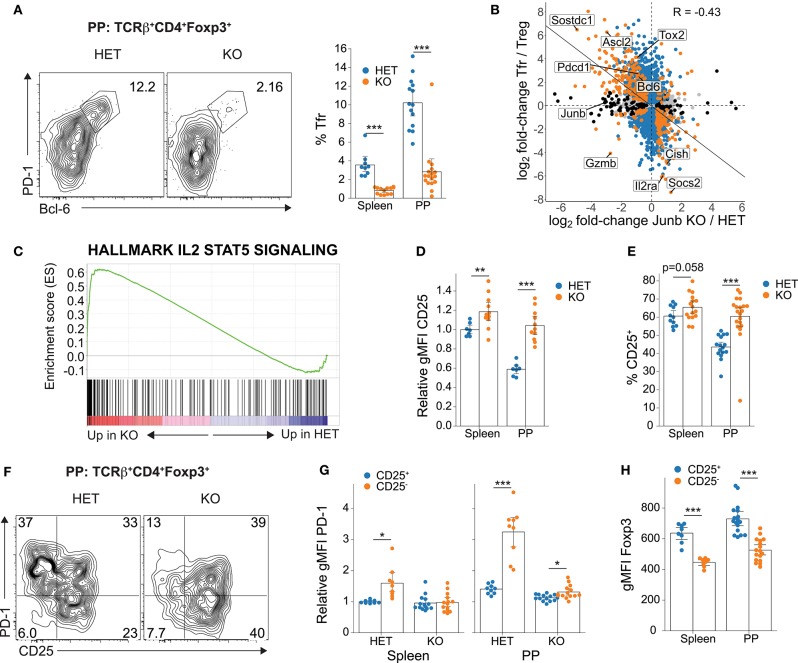
Loss of JunB selectively ablates Tfr cells and CD25− Treg cells. (A) Representative flow cytometry plots showing PD-1hiBcl-6+ Tfr cells (left). Summary data (right) are compiled from Tfr cells identified as either PD-1hiBcl-6+ or PD-1hiCXCR5+ and include at least nine animals per group from five separate experiments. (B) Relationship between the Tfr cell transcriptome and JunB-dependent transcriptome. Orange indicates significant DE in both datasets, while blue and black indicate significant DE in Tfr and JunB datasets, respectively. A linear model was fitted to points with significant DE in at least one of the two datasets; a significant correlation was detected using the Pearson method (p < 2 × 10⁻¹⁶). (C) GSEA enrichment plot for the MSigDB Hallmarks IL-2/STAT5 signaling gene set in JunB HET vs KO RNA-seq. (D) Relative expression of CD25 on TCRβ+CD4+Foxp3+ cells (normalized to the mean gMFI for splenic Foxp3+ cells in HET mice from each experiment) and (E) percentage of CD25+ cells as determined by flow cytometry. Data are aggregated from at least seven mice per group from at least three independent experiments. Significance determined by Welch's t-test with Holm-Bonferroni correction. (F) Representative contour plot showing the relationship between CD25 and PD-1 expression. (G) Relative expression of PD-1 on CD25+ and CD25− Treg cell subsets. Data are aggregated from at least nine mice per group from four independent experiments. Significance determined by 3-way ANOVA followed by Welch's t-test with Holm-Bonferroni correction. (H) Expression of Foxp3 on CD25+ and CD25− subsets of TCRβ+CD4+Foxp3+ cells as determined by flow cytometry. Data are pooled from both HET and KO animals—at least eight per organ from two separate experiments—because ANOVA indicated no significant effect of genotype. Statistical significance determined by Welch's t-test with Holm-Bonferroni correction. All summary data represent mean with a bootstrapped 95% confidence interval. *p < 0.05; **p < 0.01; ***p < 0.001.

