
Figure 5.
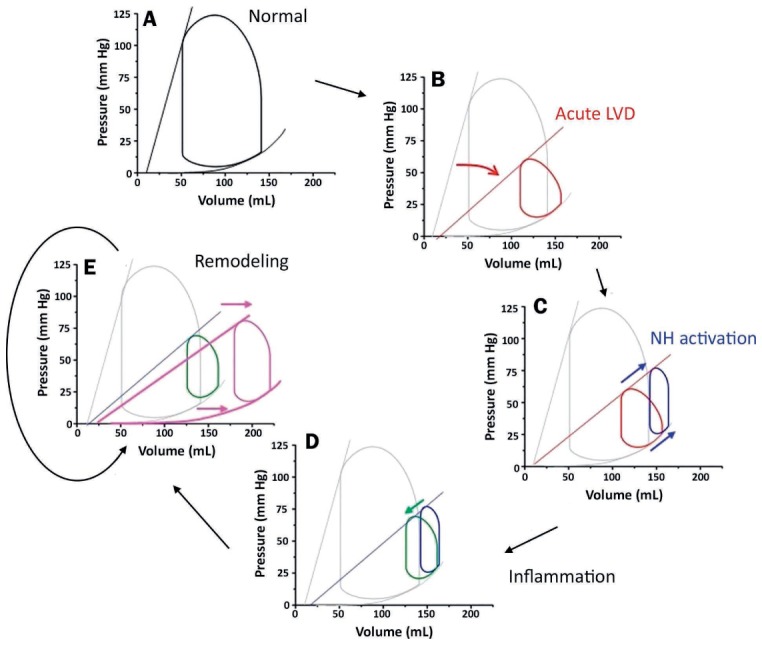
The pathophysiology of cardiogenic shock illustrated by pressure-volume (PV) loops. (A) The normal PV loop; (B) the PV loop reflecting changes following an acute myocardial infarction (red); (C) changes caused by autonomic response to decreased contractility (blue); (D) changes caused by release of inflammatory mediators (green); (E) the PV loop reflecting manifestations of cardiac remodeling (pink) with changes in both the end-systolic and end-diastolic pressure-volume relationships. Reprinted with permission.23