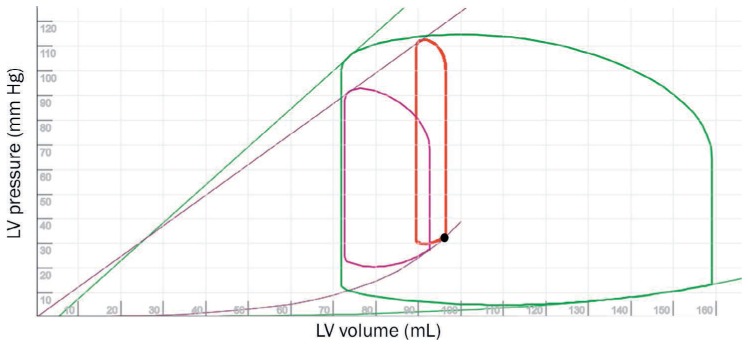
Figure 2.

Pressure-volume (PV) loop showing the impact of extracorporeal membrane oxygenation in a poorly functioning left ventricle (LV; red loop). While the systemic arterial pressure has increased compared to the cardiogenic shock state (purple loop), the end-diastolic volume has increased with a significant increase in afterload (red loop). The green loop represents a normally functioning heart. Purple and green lines represent contractility (end-systolic PV relationship; ESPVR) and purple and green curves represent ventricular elastance (end-diastolic PV relationship; EDPVR). See Online Video 2.
