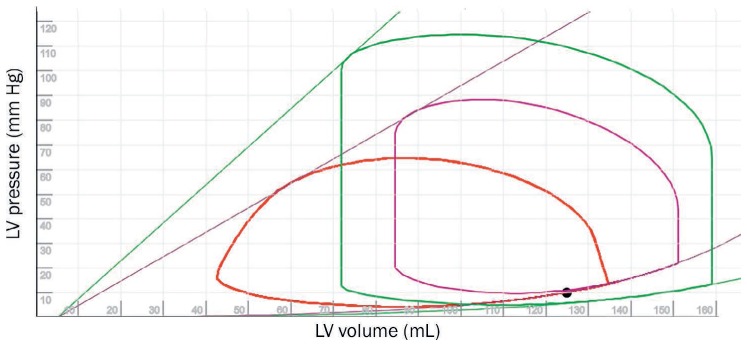
Figure 7.

Pressure-volume (PV) loops illustrating the physiology of a ventricular septal defect (VSD). The green PV loop represents the normal state, the purple loop represents an acute heart failure state, and the red loop represents a VSD in the setting of acute heart failure. Note that the onset of a VSD has changed the shape of the PV loop, reflective of decreased afterload, shortened isovolumetric time, and higher stroke volume. Although the lines for end-systolic PV relationship (ESPVR; straight lines) and end-diastolic pressure-volume relationship (EDPVR; bottom curves) are different compared to normal PV loop, they are the same for acute heart failure with and without a VSD, suggesting that the true myocardial properties have not changed. See Online Video 3. LV: left ventricle.
