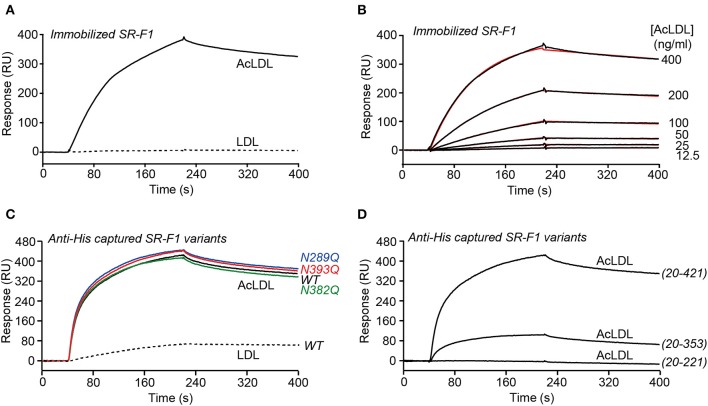
Figure 3.
SPR analyses of the interaction of SR-F1 variants with LDL and AcLDL. LDL and AcLDL (0.4 μg/ml) (A) or AcLDL at the indicated concentrations (B) were injected over covalently immobilized SR-F1 (3,000 RU) in TBS, pH 7.4 at a flow rate of 20 μl/min. Fits (shown as red lines) were obtained by global fitting of the data using a 1:1 Langmuir binding model. (C) AcLDL (4 μg/ml) was injected over 450–500 RU SR-F1 and its N-deglycosylated mutants (N289Q, N382Q, and N393Q) captured on covalently immobilized anti-His tag antibody (1,300 RU). LDL (4 μg/ml) was injected over wild-type captured SR-F1. (D) AcLDL (4 μg/ml) was injected over equimolar amounts of captured SR-F1(20-421), SR-F1(20-353), and SR-F1(20-221) (corresponding to 520, 372, and 184 RU, respectively). Injections over oriented SR-F1 proteins (C,D) were performed in TBS containing 1 mM CaCl2 at a flow rate of 20 μl/min. The data shown are representative of at least 2 separate experiments using the T200 and the Biacore X apparatus.

