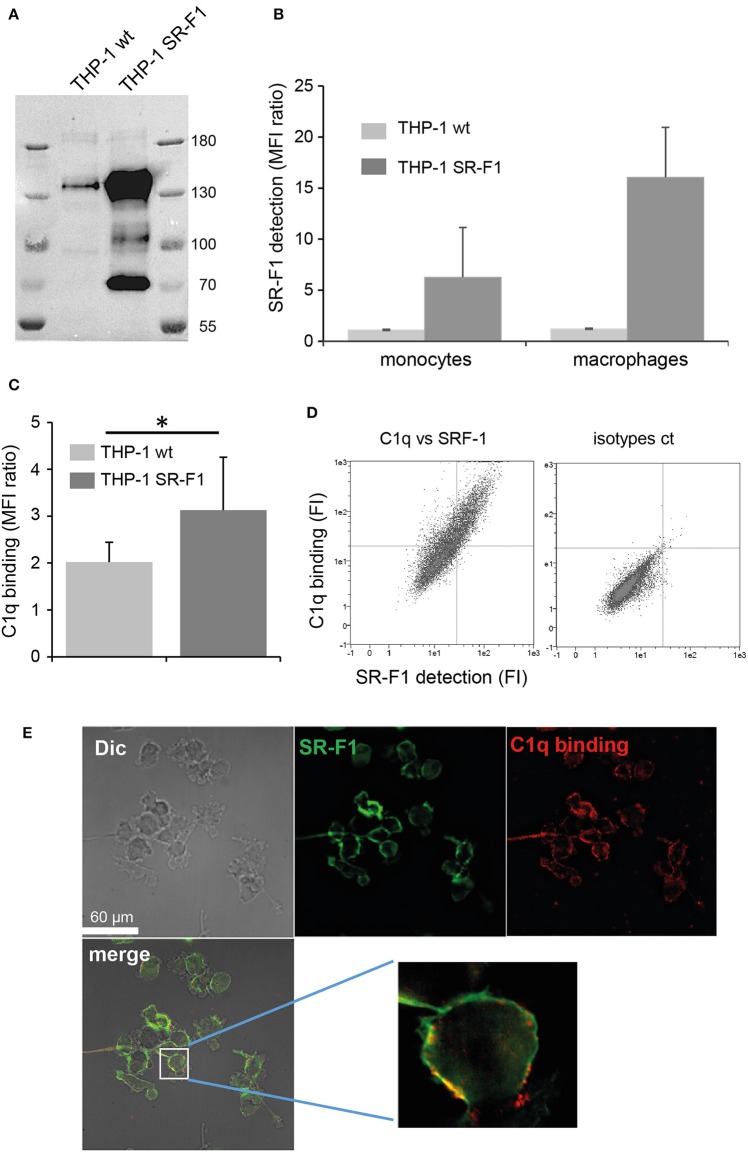
Figure 5.
SR-F1 overexpression increases C1q binding to macrophages. (A) SR-F1 detected by western blotting on wild-type or SR-F1 overexpressing THP-1 cells (PMA-treated), following SDS-PAGE on a 7.5% acrylamide gel under reduced conditions. Mass markers (kDa) are shown. (B) SR-F1 cell surface expression measured by FACS (n = 3) on THP-1 cells differentiated or not into macrophages as indicated. (C) C1q binding to the THP-1 cells (PMA-treated), analyzed by FACS. (D) A representative dot plot of the FACS analysis of C1q binding vs. SR-F1 expression (left) and the corresponding control (right). (E) C1q and SR-F1 colocalize on the surface of SR-F1 overexpressing THP1 macrophages. Samples were visualized by confocal microscopy under differential interference contrast (DIC). AF 405 (shown in green) and Cy-3 (shown in red) filters, and merge are shown (as indicated). Higher magnification is shown for one selected cell. MFI, median fluorescent intensity. *p < 0.05. Experimental conditions are described in Materials and Methods.

