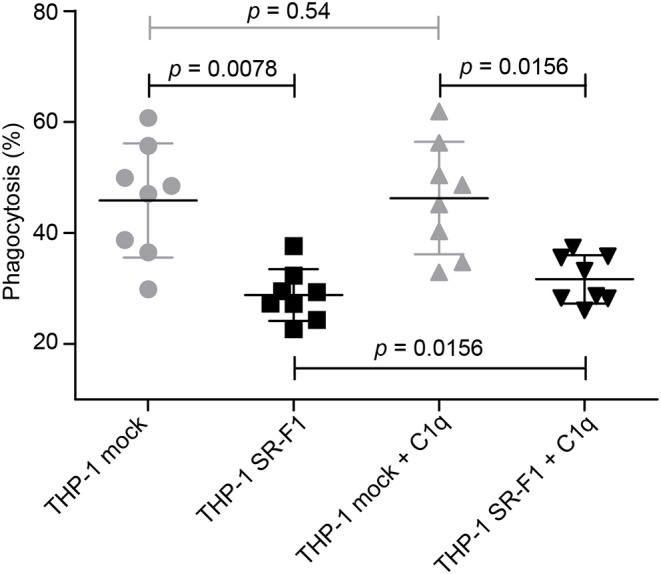
Figure 7.

Comparative phagocytosis of late apoptotic JurkaT cells by THP-1 and SR-F1 overexpressing THP-1 macrophages, in the presence or absence of C1q. The scatter plot shows (n = 8) a horizontal line at the mean ± SD. Exact p-values are indicated. Experimental conditions are described in Materials and Methods.
