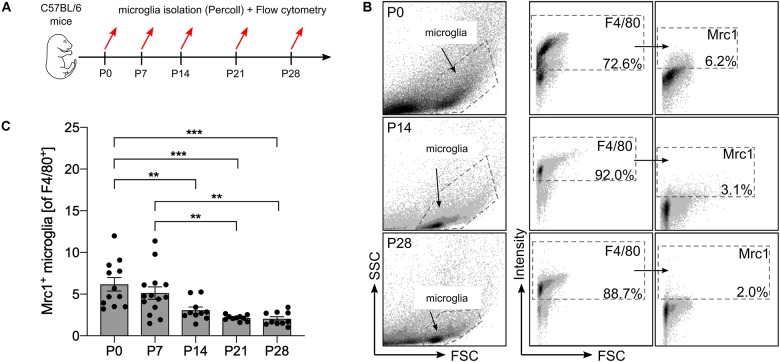
FIGURE 1.
Analysis of postnatal Mrc1 expression in microglia in vivo. (A) Workflow scheme depicting the time points for acute microglia isolation and flow cytometry. (B) Gating strategy and representative dot plots of F4/80+ and Mrc1+ microglia from P0, P14, and P28 brains. (C) Quantification of Mrc1+ microglia at the analyzed postnatal developmental stages. Data are given as percentages of F4/80+ microglia ± SEM [n = 12 (P0), n = 14 (P7), n = 10 (P14), n = 10 (P21), and n = 10 (P28)]. P-values derived from one-way ANOVA followed by Tukey’s multiple-comparison test are **p < 0.01 and ***p < 0.001.

