FIGURE 3.
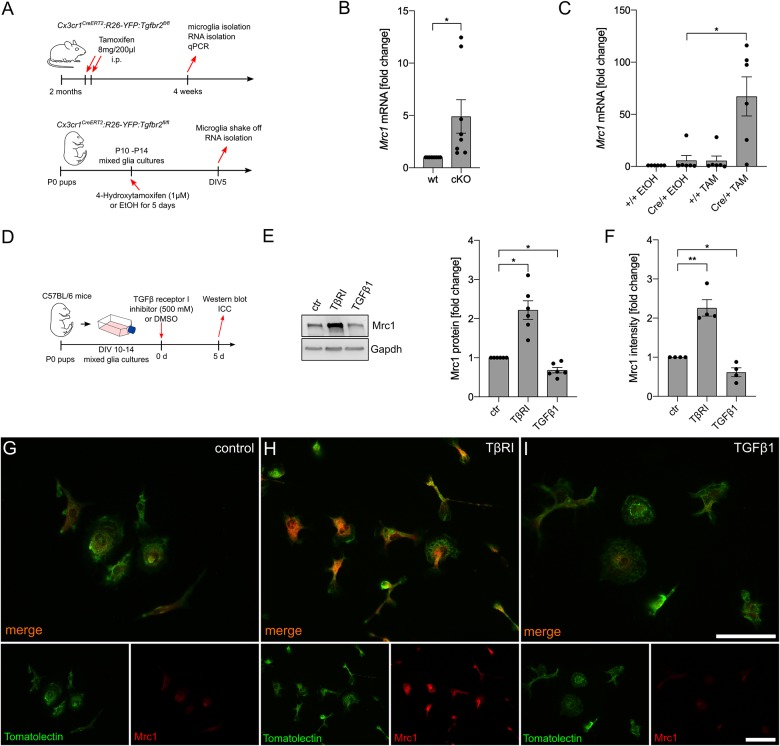
Inhibition of microglial TGFβ signaling results in the upregulation of Mrc1. (A) Schemes illustrating the workflow of tamoxifen-induced recombination and microglia isolation from adult Cx3cr1CreERT2:R26-YFP:Tgfbr2fl/fl mice as well as the tamoxifen-induced recombination and analysis of postnatal microglia in vitro isolated from P0 Cx3cr1CreERT2:R26-YFP:Tgfbr2fl/fl mice. (B) Expression of Mrc1 in adult microglia with intact (wt) and disrupted TGFβ signaling (cKO). (C) Cre/+ microglia showed a significantly increased expression of Mrc1 after tamoxifen-induced recombination in vitro. (D) Scheme depicting TGFβ receptor type I inhibitor and TGFβ1 treatment for the evaluation of Mrc1 proteins in vitro. (E) Representative western blot and quantifications showing the significantly increased protein levels of Mrc1 after inhibition of microglial TGFβ signaling as well as significant downregulation of Mrc1 after TGFβ1 treatment for 5 days. (F) Quantifications of the Mrc1 fluorescence intensities after immunocytochemistry reveal a significantly increased intensity after abrogation of TGFβ signaling in the microglia and significant downregulation of Mrc1 fluorescence intensities after TGFβ1 treatment. Data are given as means ± SEM from at least three independent experiments. P-values derived from Student’s t-test (B) or one-way ANOVA followed by Tukey’s multiple-comparison test (C), (E), (F) are *p < 0.05. Immunocytochemistry showing the expression of Mrc1 in primary microglia after treatment for 5 days. Whereas the control microglia (G) and the TGFβ1-treated cells (I) show weak immunoreactivity for Mrc1, inhibition of TGFβ signaling resulted in increased Mrc1 staining intensity (H). FITC-coupled tomatolectin was used as a microglia marker. Scale bars represent 50 μm.

