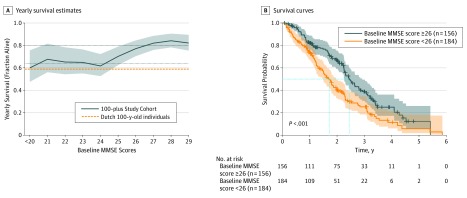
Figure 2. Association of Mini-Mental State Examination (MMSE) Scores With Survival.
A, Graph shows yearly survival estimates for the 100-plus Study cohort. Dashed orange line shows the survival fraction of the individuals aged 100 years within the Dutch general population, which was derived from the Netherlands Central Bureau of Statistics.35 Dotted lines show mean survival percentage of centenarians with baseline MMSE score less than 24 (bottom) and mean survival percentage of centenarians with baseline MMSE score less than 26 (top). Solid line and shaded area show mean (95% CI) survival for participants in the 100-plus Study cohort. The MMSE scores were associated with survival using sliding windows with a size of 3 MMSE points. B, Graph shows Kaplan-Meier survival curves of centenarians with high (≥26 [gray]) and low (<26 [orange]) MMSE scores at baseline.

