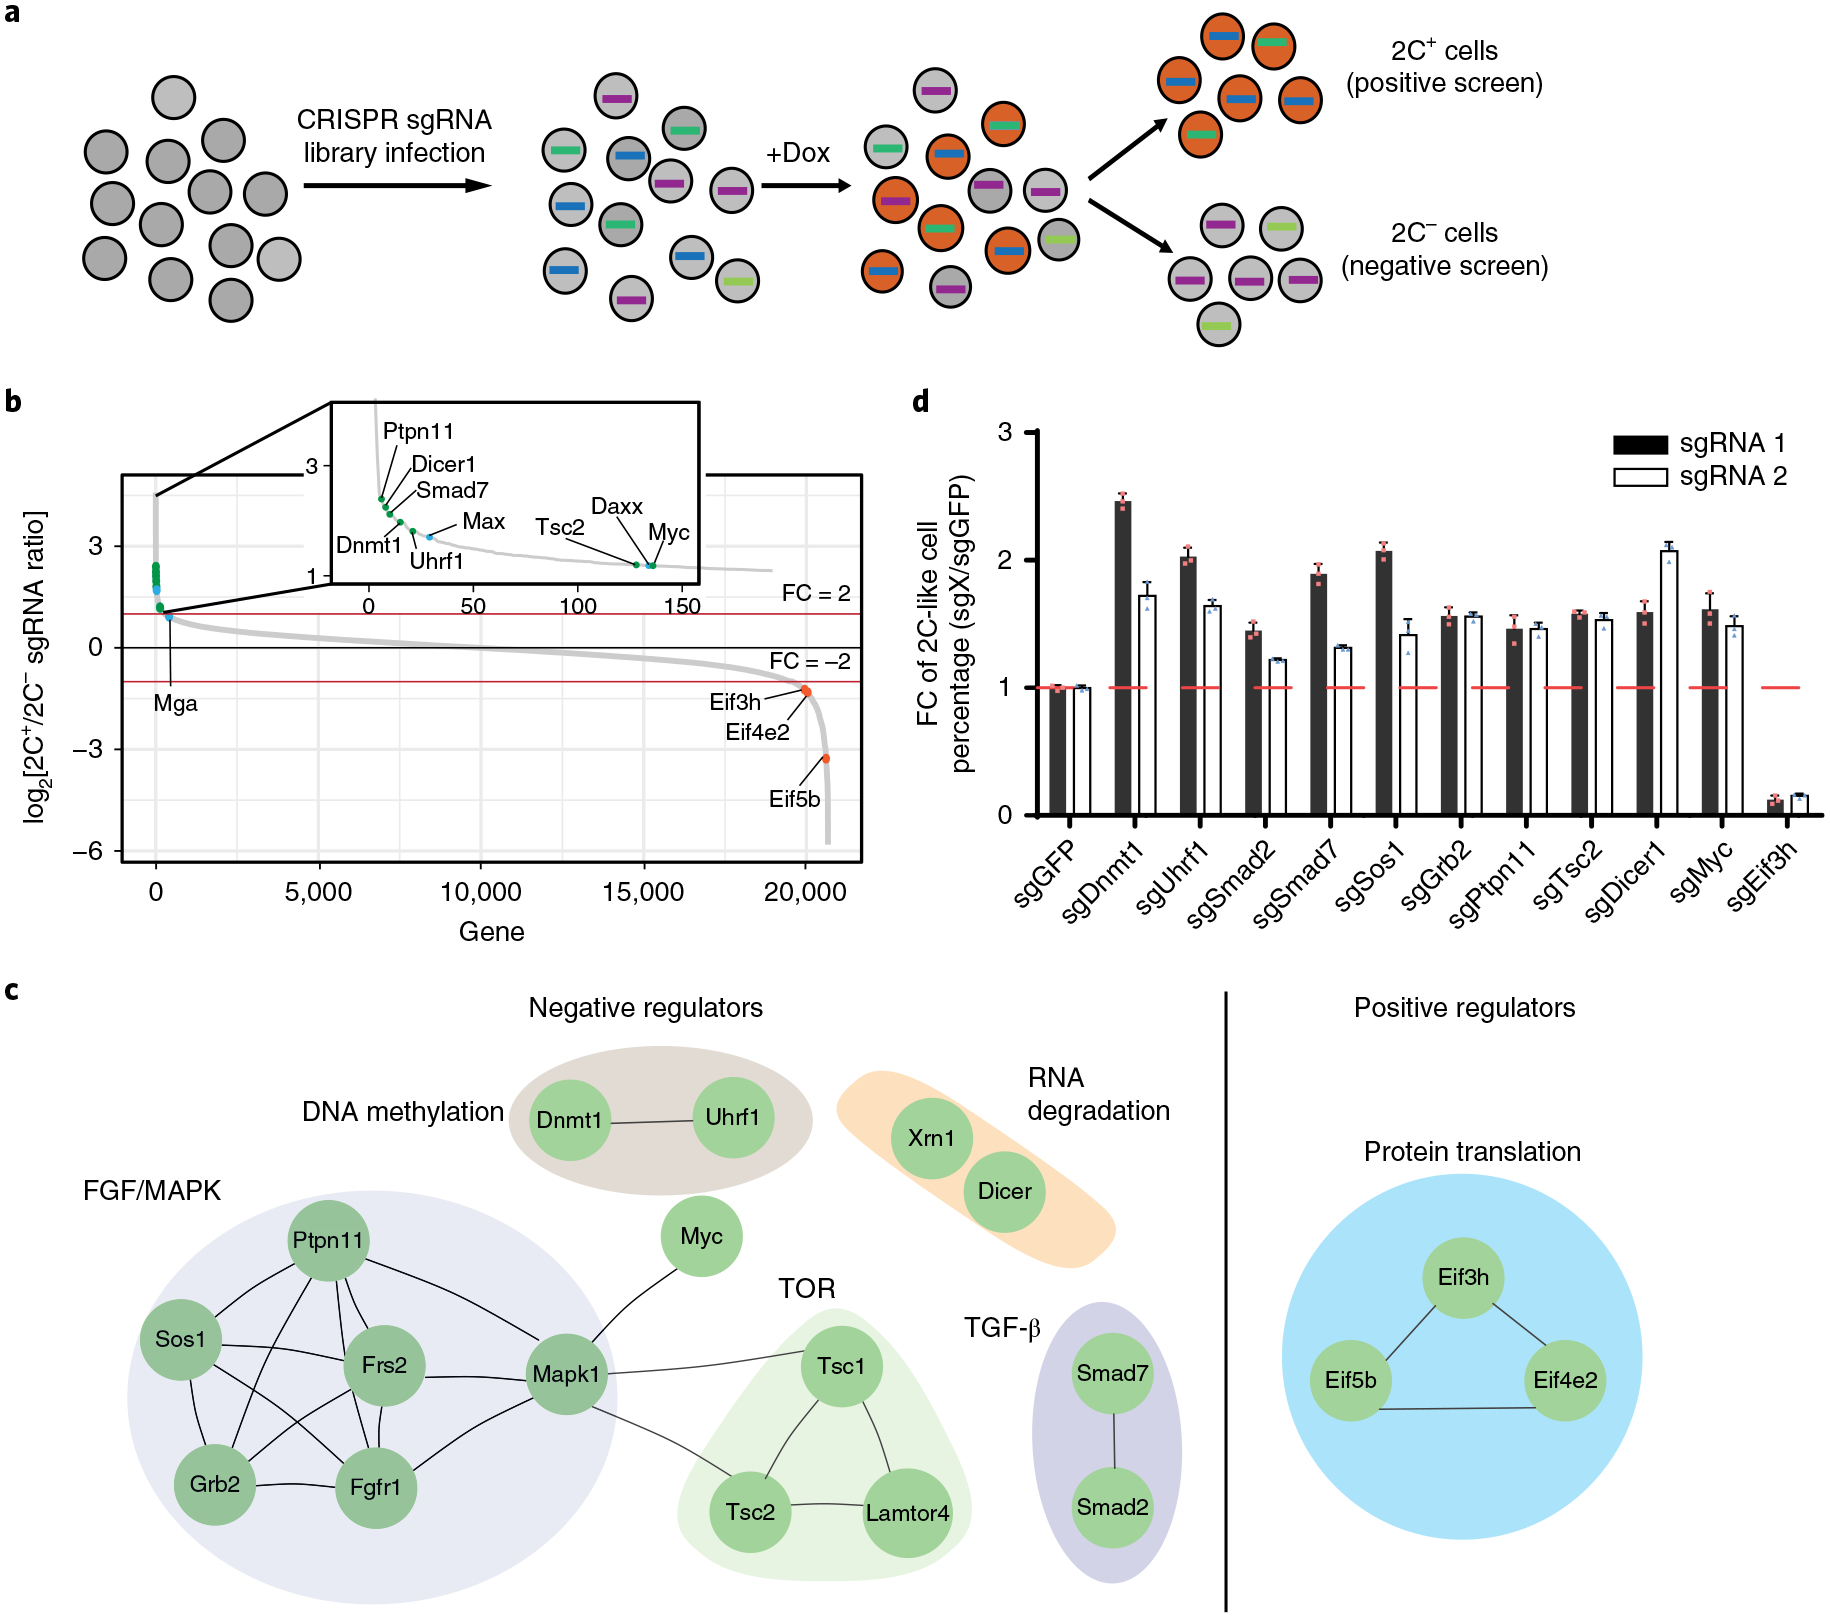
Fig. 3 |. CRISPR–Cas9 screening identified regulators mediating the ESC to 2C-like cell transition.

a, A schematic of the CRISPR–Cas9 screen. Two biologically independent screens were performed. b, The sgRNA count enrichment from the first screen replicate. Notably, several known negative regulators, such as Daxx, Max and Mga, were also identified in the screen, supporting the validity of our screen. The green dots indicate inhibitors identified by this screen, the orange dots indicate positive regulators identified by this screen, and the blue dots indicate known regulators. c, The interaction network of the top candidates identified from the screen. d, The fold change (FC) of the 2C-like cells relative to the sgGFP control after 1 d Dux induction. The X in sgX refers to the gene that sgRNA targets to. Shown are mean ± s.d., n = 3 biologically independent samples. The experiment was repeated independently twice with similar results. The source data can be found in Supplementary Table 10.
