
Fig. 1.
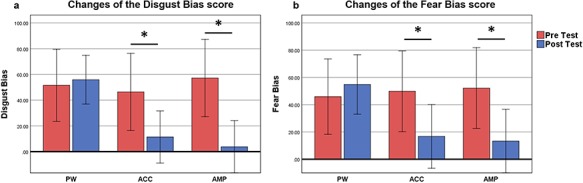
Changes in attention bias score as represented by emotional Stroop task performance. (a) Disgust bias score changes in PW, ACC and AMP, calculated as the difference in RTs in response to disgust faces and neutral faces. (b) Fear bias score change in PW, ACC and AMP, calculated as the difference in RTs in response to fear faces and neutral faces. *P < 0.05. The error bar represents 95% confidence interval.