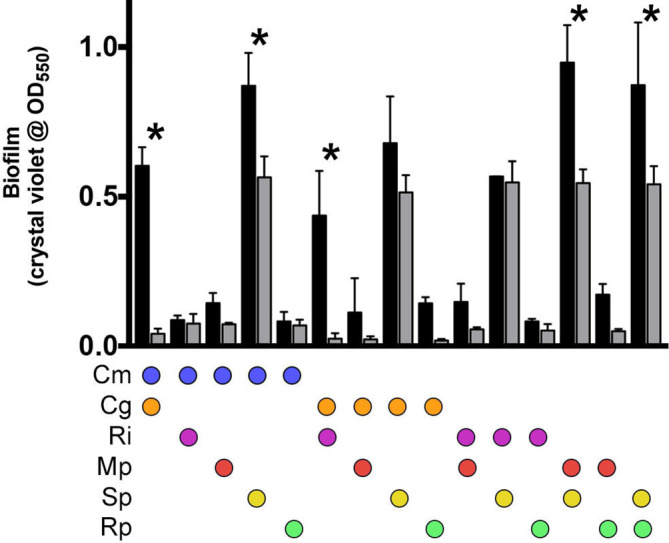
Fig. 3.

Biofilm formation between all two-species combinations from the six-member community. Black bars represent the means of the experimentally measured biofilm formation between these two members and the grey bars represent the means of the predicted biofilm formation based on individual species biofilm formation starting at equal proportions. The error bars represent the standard deviation. Analysis was performed using two-way ANOVA with Sidak’s post-test to compare actual measures with predicted measures within each two-species mix (*, P<0.01). Cm, C. metallidurans ; Cg, C. gleum ; Ri, R. insidiosa ; Mp, M. populi ; Sp, S. paucimobilis ; Rp, R. pickettii .
