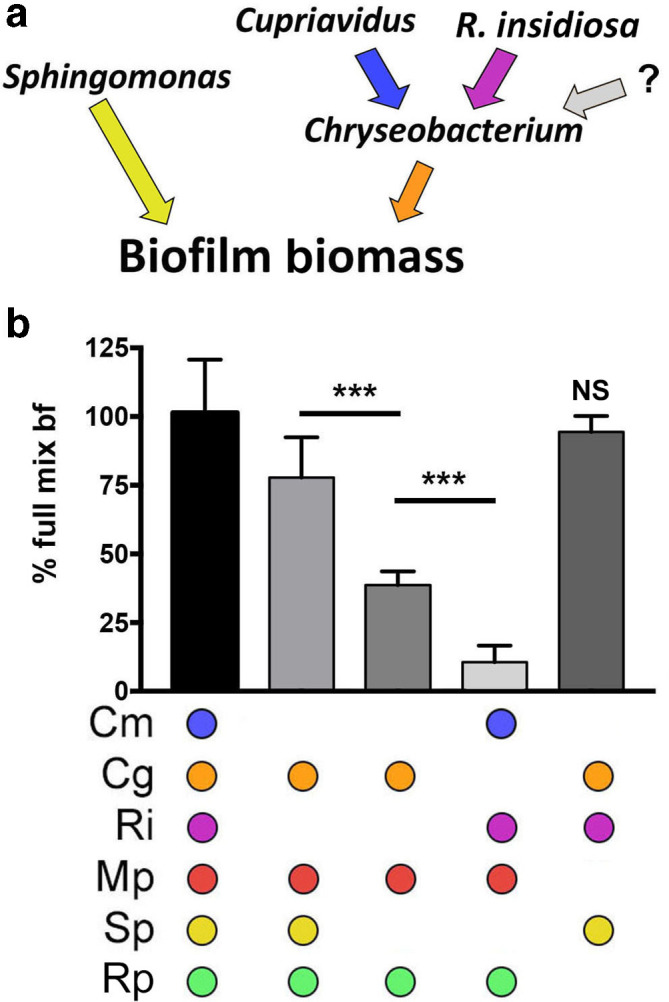
Fig. 4.

Species interaction model and explicit test for functionality within the community. (a) Model of positive species contributions to biofilm formation based on the data from Figs 1–3. (b) Test of necessity or sufficiency of community members for total biofilm formation as visualized and quantified by crystal violet. The error bars represent the standard deviation. Analysis was performed using one-way ANOVA with Tukey’s post-test comparing all pairs (***, P<0.001) with comparisons noted by bars or reported compared to the full mix. Cm, C. metallidurans ; Cg, C. gleum ; Ri, R. insidiosa ; Mp, M. populi ; Sp, S. paucimobilis ; Rp, R. pickettii ; ns, not significant. ‘?’ denotes an unknown combination of species.
