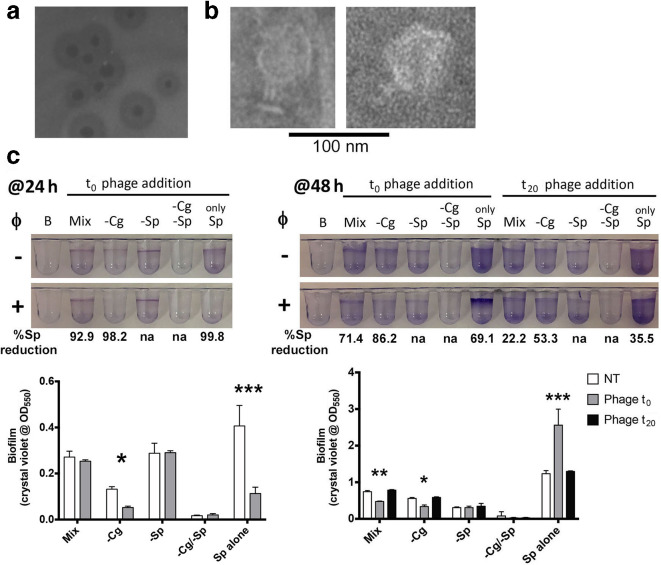
Fig. 5.
Treatment of bacterial biofilms with the S. paucimobilis phage ΦScott. (a) Image of plaque formation on a lawn of S. paucimobilis . Note the wide halos of lysogens. (b) TEM imaging from a high-titre ΦScott preparation. (c) Biofilm formation visualized and quantified with the presence (+) and absence (−) of ΦScott treatment. Reduction in S. paucimobilis c.f.u. reported below crystal violet images normalized to non-treated values. Quantified biofilm formation data analysed using two-way ANOVA with Sidak’s multiple comparison testing for the 24 h time point (testing non-treated vs phage-treated) and with Dunnett’s post-test for the 48 h time point (testing t 0 and t 20 phage, each versus non-treated), with significance denoted by *, P<0.05; **, P<0.01; ***, P<0.001. Mix, complete community; Cg, C. gleum ; Sp, S. paucimobilis ; NT, non-treated.’−’ denotes that that community member has been left out.

