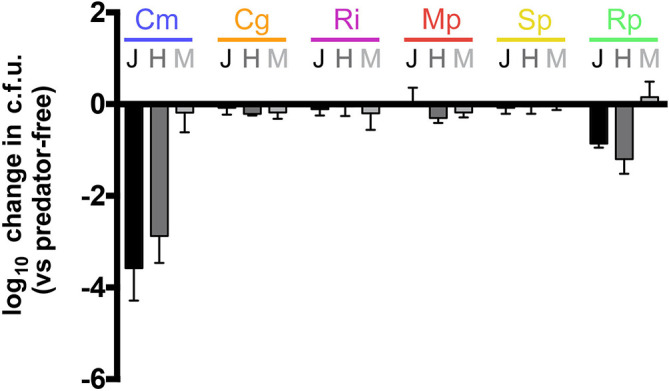
Fig. 6.

Quantification of bacterial predation in planktonic culture by predatory bacteria. Co-cultures were prepared by adding prey cells to harvested predator cells. Values represent maximal population change (log10) of each species, compared to a predator-free control, following predation. Each experiment was conducted at least three times and the error bars represent the standard deviation. Cm, C. metallidurans ; Cg, C. gleum ; Ri, R. insidiosa ; Mp, M. populi ; Sp, S. paucimobilis ; Rp, R. pickettii ; J, Bdellovibrio bacteriovorous 109J; H, Bdellovibrio bacteriovorous HD100; M, Micavibrio aeruginosavorus.
