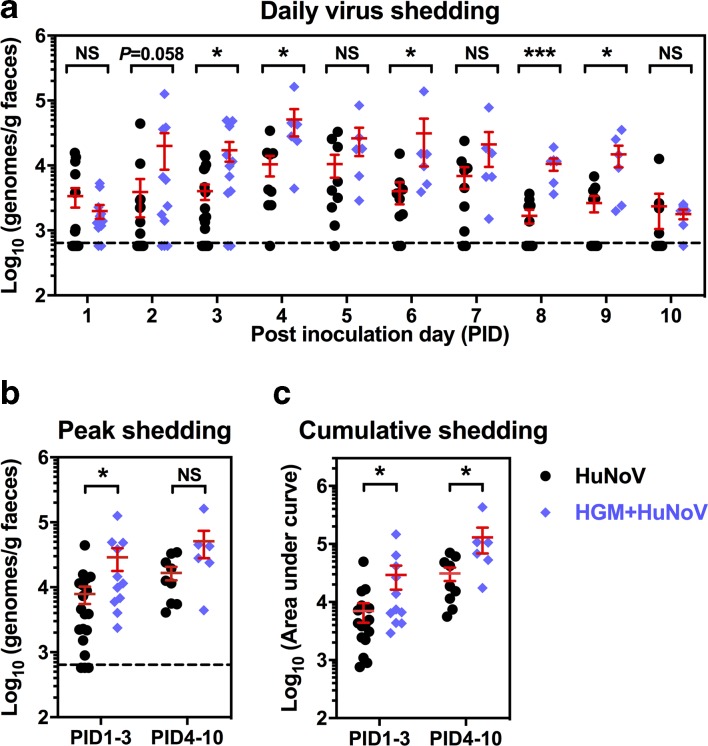
Fig. 2.
Increased faecal HuNoV shedding in HGMT pigs. (a) Daily virus shedding was measured from PID1 to PID10 by quantitative reverse transcription (qRT) PCR to quantify HuNoV genomes in faeces. (b) Peak shedding titres during PID1 to PID3 and PID4 to PID10 in individual pigs were present. (c) Individual pigs’ cumulative shedding was shown as the area under curve based on daily virus shedding in (a). Sample sizes are indicated in Table 1. Dashed line shows the limit of detection. Data were combined from four independent experiments and presented as individual animal data points with mean±sem. Statistical significance was determined by Mann–Whitney test. NS, not significant, *P<0.05, **P<0.01.

