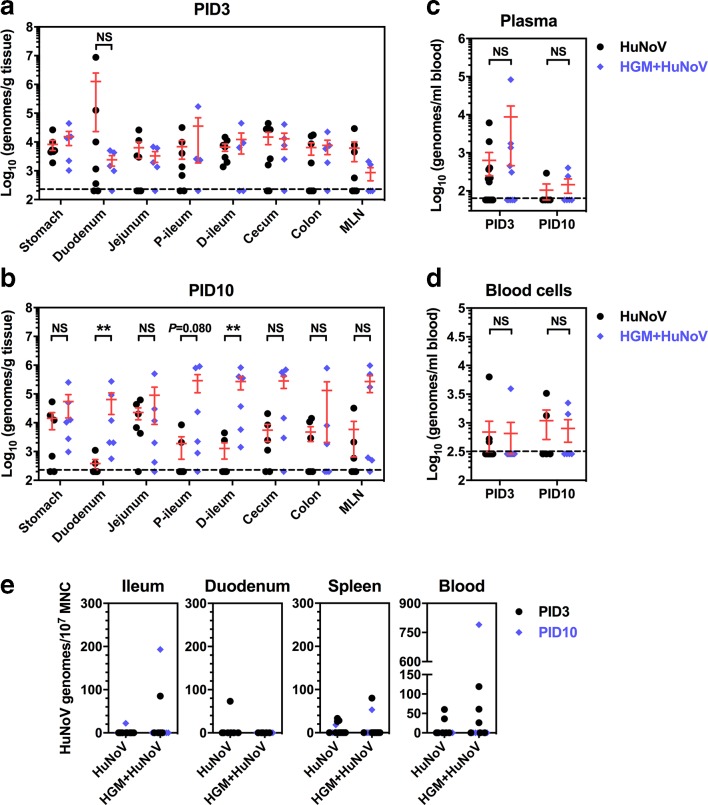
Fig. 4.
HuNoV distribution in gut tissues, blood and MNCs. HuNoV genomes in gut tissues from pigs euthanized on PID3 (a) and PID10 (b) were quantified by qRT-PCR. P-ileum, proximal ileum; d-ileum, distal ileum. HuNoV genomes in plasma (c), whole blood cells (d), and mononuclear cells (MNCs) were quantified by qRT-PCR. (a, b) HuNoV group size: PID3 n=7, PID10 n=6. HGM+HuNoV group size: PID3 n=5, PID10 n=6. (c–e) Group sizes were shown in Table 1. Dashed line shows the limit of detection. Data were combined from four to five independent experiments and presented as individual animal data points with mean±sem. Statistical significance was determined by Mann–Whitney test. NS, not significant, *P<0.05, **P<0.01.

