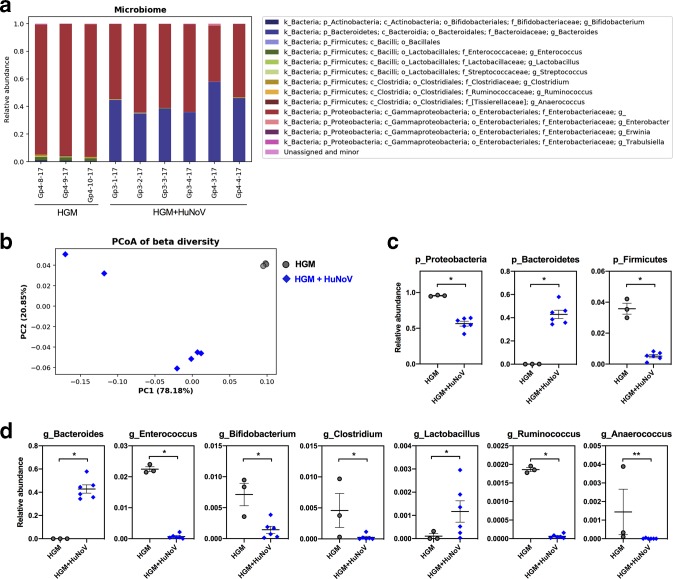
Fig. 5.
Microbiome composition analysis of HGMT Gn pigs. (a) Bacterial taxonomic summary showing relative abundance at the genus level. Unassigned and minor group includes genus less than 0.1 % of total community in each sample. (b) Principal coordinate analysis (PCoA) of beta diversity based on weighted UniFrac distances among HGMT Gn pigs. The first two axes that explain largest variations (PC1 and PC2) are plotted. Significantly different taxa at the phylum level (c) and at the genus level (d) between the HGM group and HGM+HuNoV group. (c, d) Data are presented as individual animal data points with mean±sem. Statistical significance was determined by Mann–Whitney test. *P<0.05, **P<0.01.

