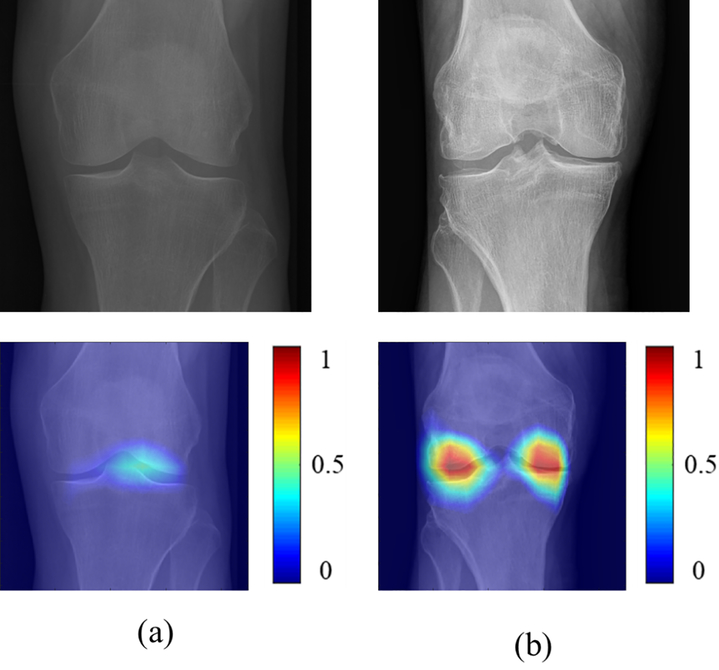
Figure 5:
Saliency maps for baseline knee X-rays in the hold-out testing group (a) without progression of radiographic joint space loss and (b) with progression of radiographic joint loss evaluated by the combined joint training model. Note that the discriminative high activation regions on the X-rays on which the classification CNN based its interpretation were centered on the joint space and surrounding bone (color regions).

