Fig. 2.
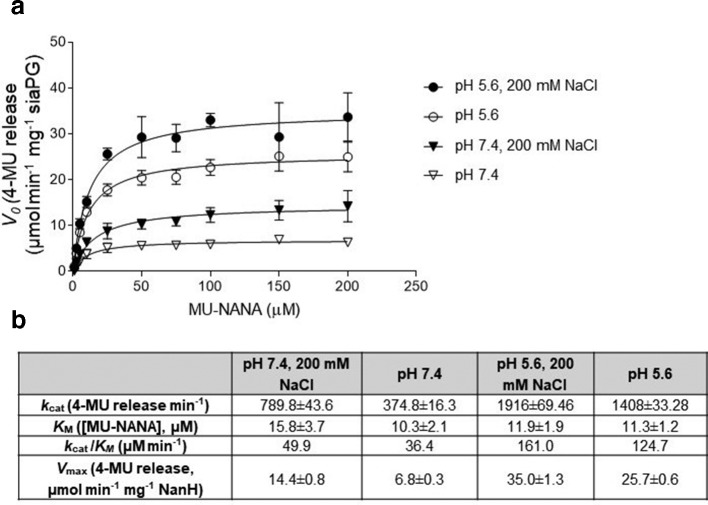
Reaction kinetics of MUNANA and SiaPG under different conditions. Variable concentrations of MUNANA were exposed to SiaPG, under different pH and salinity conditions. Reactions were quenched by addition of pH 10.5 buffer at 1, 2, and 3 min, and the rate of 4-MU release determined by application of a 4-MU standard curve. (a) Michaelis–Menten plot, rate of 4-MU release (V0, µmol MU released min−1 mg−1 SiaPG), plotted against [MUNANA] (µM) using Prism 7 (GraphPad). Error bars, sd (b) Table summarizing Michaelis–Menten reaction kinetics and catalytic efficiency of SiaPG and MU-NANA, the table includes the k cat (4-MU release min−1), and k cat/KM (µM min−1). Data shown represent the mean (±sd) of one experiment, where each condition was repeated three times per experiment.

