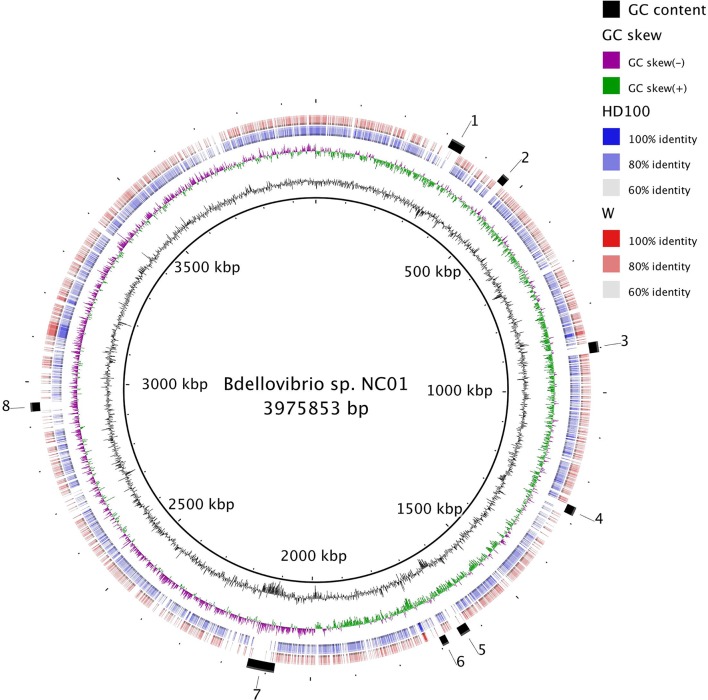
Fig. 3.
Genome-wide pairwise comparisons of Bdellovibrio nucleotide sequences. The genome of Bdellovibrio sp. NC01 is shown as the innermost ring. The next ring is a plot of GC content and the purple and green ring is a plot of GC skew, both of which were generated by BRIG using sliding windows to determine deviation from the average value for the genome. The blue ring and red ring show pairwise nucleotide sequence alignments of NC01 to HD100 and W, respectively. Each individual alignment is shown as a block along the ring, and colour gradation of the blocks reflects the percent similarity of alignments. The outermost ring denotes eight regions lacking alignments, which may indicate unique NC01 gene content.

