
Fig. 4.
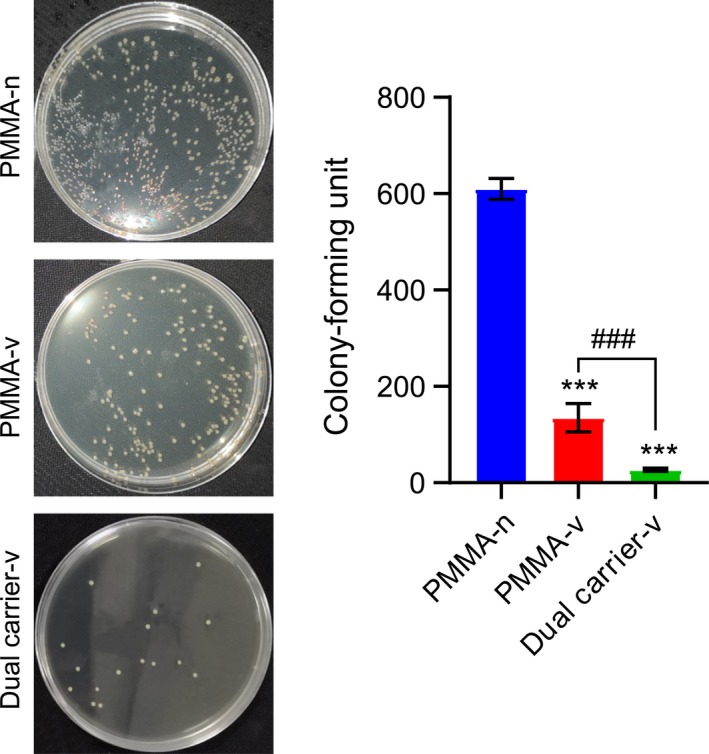
Representative images and statistics of CFUs of S. aureus. n = 5; mean ± SD; one‐way ANOVA with Tukey’s post hoc test, ***P < 0.001, ### P < 0.001.
Official websites use .gov
A
.gov website belongs to an official
government organization in the United States.
Secure .gov websites use HTTPS
A lock (
) or https:// means you've safely
connected to the .gov website. Share sensitive
information only on official, secure websites.
Representative images and statistics of CFUs of S. aureus. n = 5; mean ± SD; one‐way ANOVA with Tukey’s post hoc test, ***P < 0.001, ### P < 0.001.