Fig. 5.

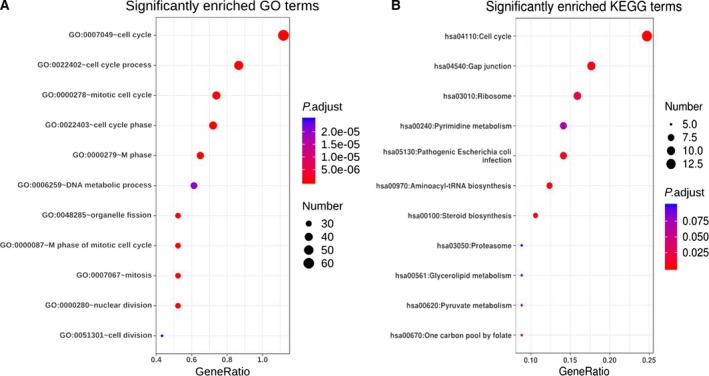
Overview of significant enriched GO and KEGG pathways. Each bubble indicates a term. The size of the bubble represents the number of involved genes. Lighter colors indicate smaller P‐values. (A) Enriched GO terms. (B) Enriched KEGG terms.

Overview of significant enriched GO and KEGG pathways. Each bubble indicates a term. The size of the bubble represents the number of involved genes. Lighter colors indicate smaller P‐values. (A) Enriched GO terms. (B) Enriched KEGG terms.