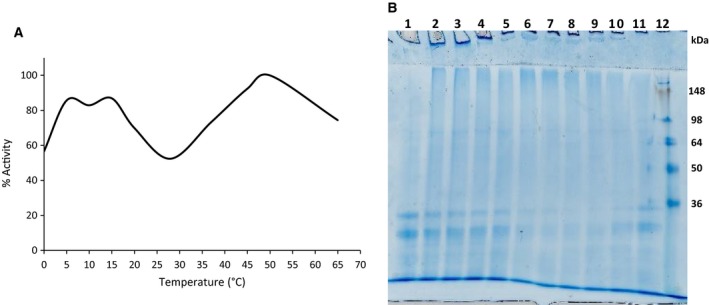
Fig. 4.

Influence of temperature on AcTG‐1 activity. The activity of AcTG‐1 was tested after 1 h of incubation at various temperatures and then stopped with the addition of EDTA (A). Data are given as the mean of three measurements and the highest value of the activity was set as 100%. Casein was separated by a 12% SDS/PAGE gel after incubation with TG (B). Samples of TG were incubated with casein for 1 h at 16 °C, and then, the reaction was stopped by the addition of EDTA. Samples used in a 12% SDS/PAGE gel analysis: lane 1: control (no TG); lane 2: 0 °C; lane 3: 5 °C; lane 4: 10 °C; lane 5: 15 °C; lane 6: 20 °C; lane 7: 28 °C; lane 8: 37 °C; lane 9: 45 °C; lane 10: 50 °C; lane 11: 65 °C; and lane 12: protein standard (SeeBlue Plus2 Pre‐Stained).
