
Fig. 8.
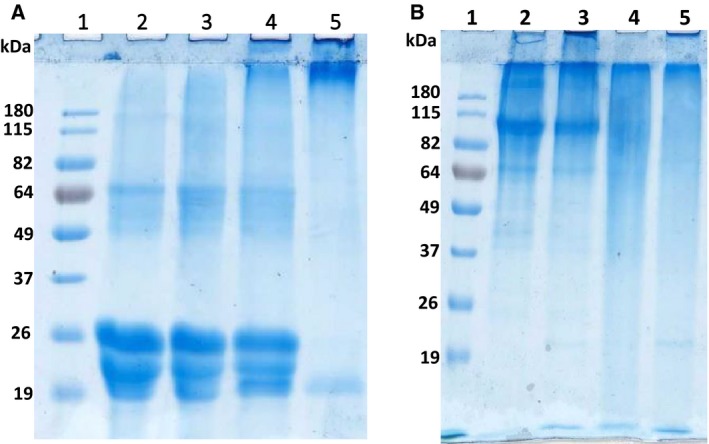
Cross‐linking of casein, collagen and gelatin upon AcTG‐1 treatment. Casein was incubated for 1 h with different concentrations of AcTG‐1 (A). Reactions were stopped by the addition of sample buffer and then analysed on a 12% SDS/PAGE gel. Separated proteins were visualised in the gel by Coomassie Brilliant Blue staining. Lane 1: protein standard (BenchMark Pre‐Stained); lane 2: no TG; lane 3: 0.35 μg AcTG‐1; lane 4: 0.5 μg AcTG‐1; and lane 5: 1 μg AcTG‐1. Fish collagen and gelatin were incubated for up to 60 min in the presence of AcTG‐1 (B). Reactions were stopped by the addition of sample buffer and then analysed on a 12% SDS/PAGE gel. Separated proteins are visualised in the gel by Coomassie Brilliant Blue staining. Lane 1: SeeBlue Plus2 marker; lane 2: collagen; lane 3: collagen with AcTG‐1; lane 4: gelatin; and lane 5: gelatin with AcTG‐1.