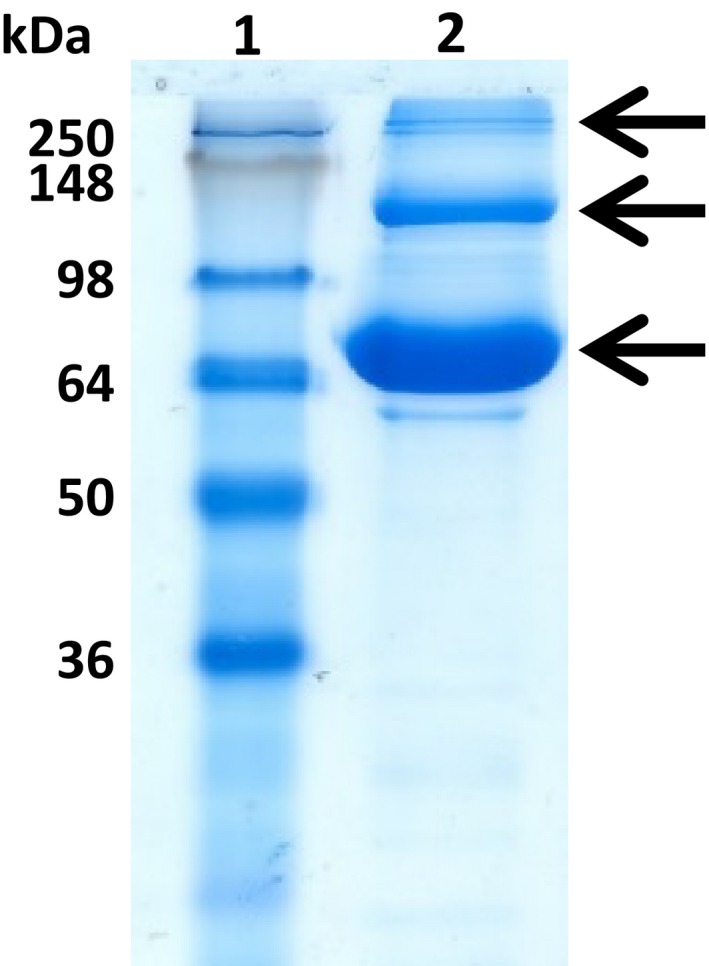
Fig. 11.

The SDS/PAGE analysis of concentrated AcTG1‐1. The fractions were run on a 12% SDS/PAGE gel at 180 V for 1 h and stained with Coomassie Brilliant Blue. The numbers at the top indicate lanes and the molecular weights of the standards are indicated at the left margin. Lane 1: protein ladder (SeeBlue Plus2 Pre‐Stained); and lane 2: concentrated AcTG‐1 (12 mg·mL−1). The positions of AcTG‐1 are indicated by the arrows.
