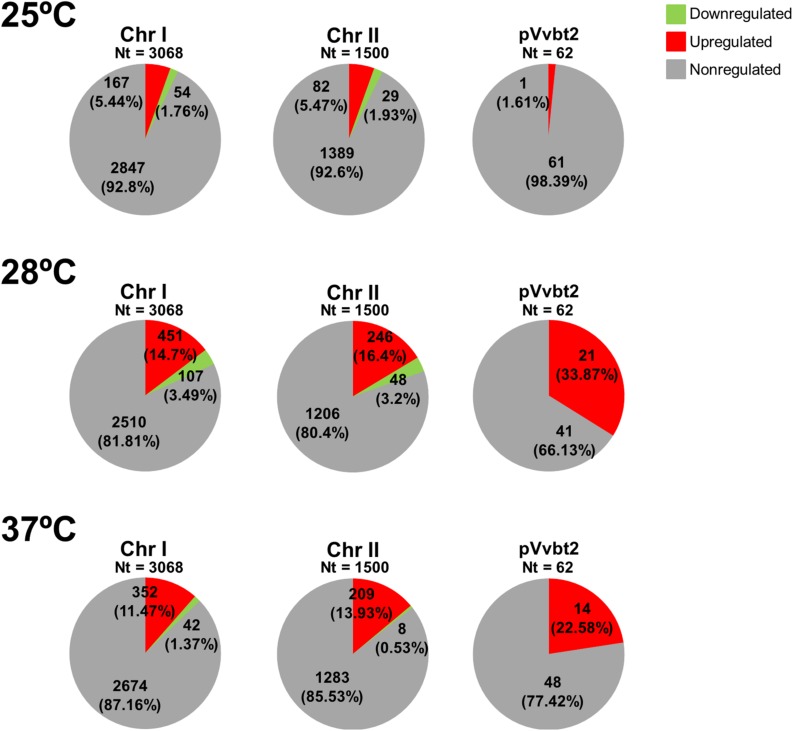
FIGURE 2.
Graphical representation of DEGs distribution among V. vulnificus genome in response to temperature. Figure shows the DEGs according to their distribution per regulation category (upregualted, downregulated, or non-regulated) and replicon (two chromosomes and one plasmid). The different categories are represented by color.

