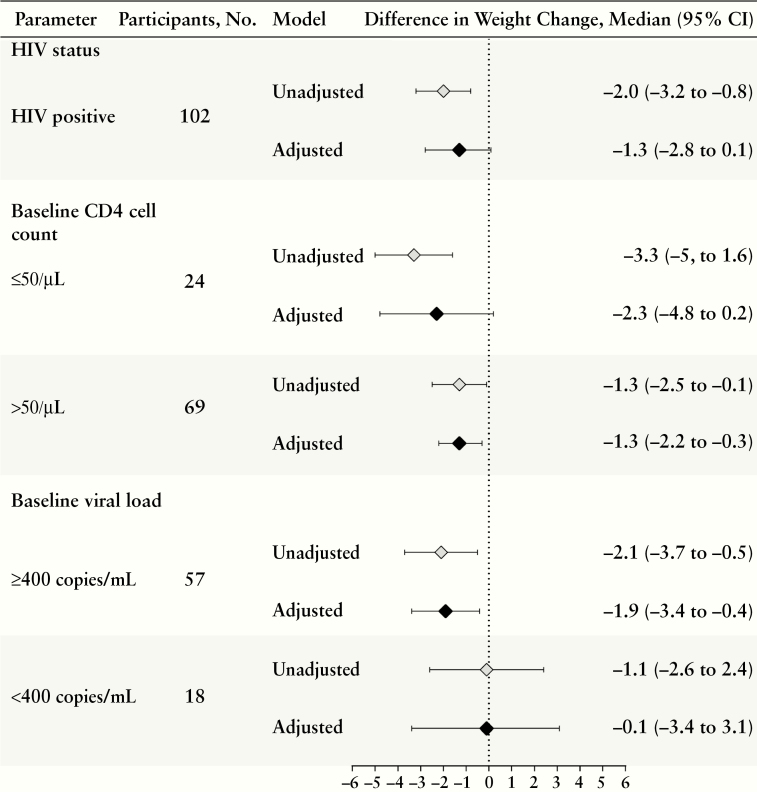
Figure 2.
Crude and adjusted analysis of association between human immunodeficiency virus (HIV)–related characteristics and weight change during the first 2 months of tuberculosis treatment, using bootstrapped quantile regression Adjusted models control for baseline weight, age, sex, site, smear status, and hemoglobin level. Boldface indicates statistical significance (P < .05). Abbreviation: CI, confidence interval.

