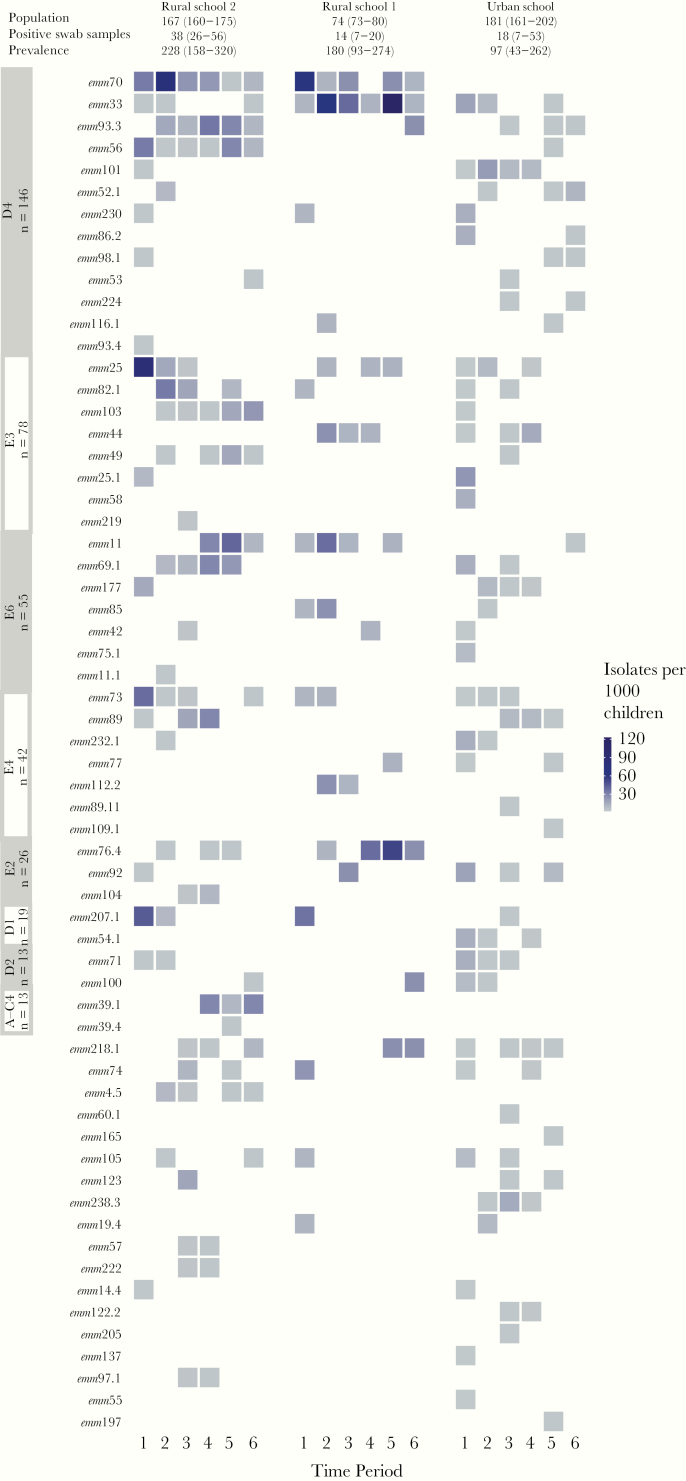
Figure 2.
Prevalence of emm types per 1000 children for each screening time period, grouped by cluster and stratified by school. The emm clusters (labeled on y-axis) are ordered by the overall number of isolates, and within each emm cluster, emm types are also ordered by overall number of isolates. Data for each school include the median population, number of positive swab samples, and overall prevalence, together with their ranges.

