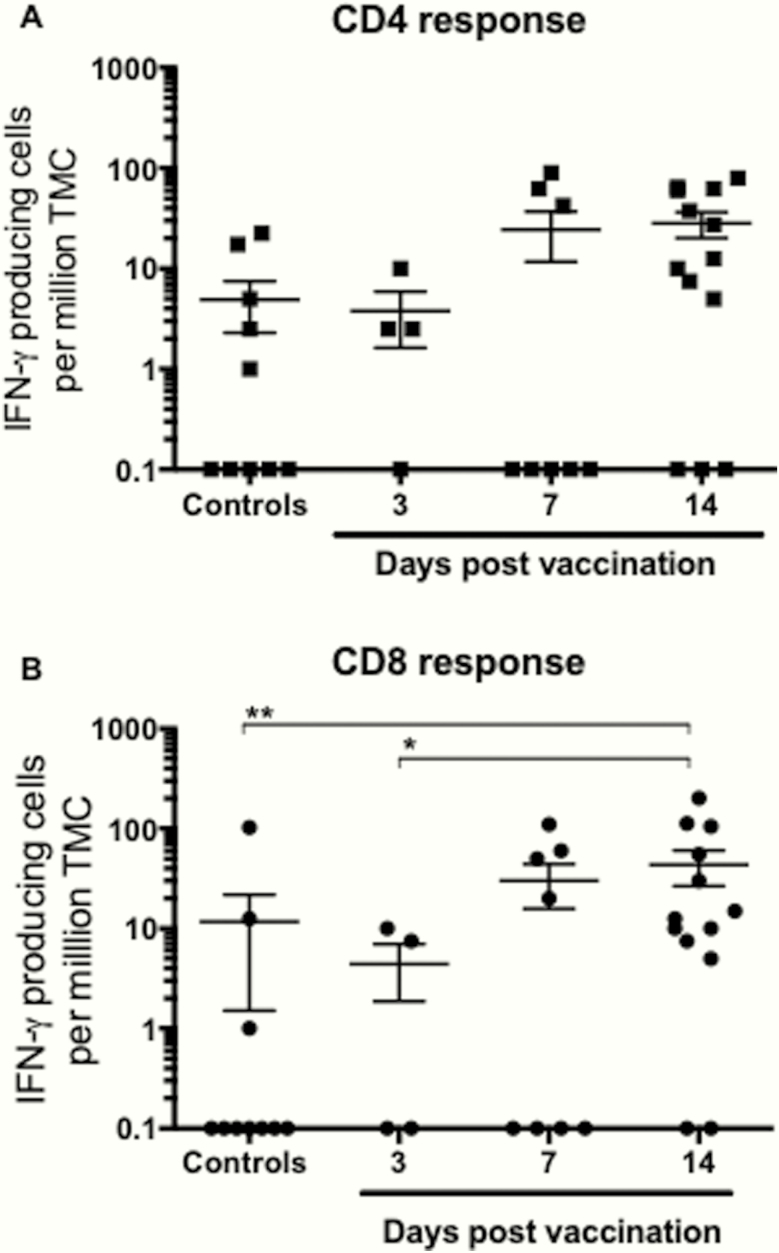
Figure 4.
Cross-reactive CD4+ and CD8+ T-cell responses after live-attenuated influenza vaccination (LAIV) vaccination. The T-cell immune response was evaluated by measuring the number of influenza-specific interferon (IFN)-γ-secreting T cells (spot-forming units [SFU]) after LAIV, using the enzyme-linked immunospot assay. Tonsillar mononuclear cells (TMC) isolated from tonsils were tested for responses against panels of peptides representing conserved T-cell epitopes (A and B). Responses to CD4 T-cell epitopes (major histocompatibility complex [MHC] class II restriction) are shown to the left, and responses to CD8 epitopes (MHC class I restriction) are shown to the right of the figure. Each symbol represents the number of influenza-specific SFU per million TMC for each child with the mean and stand error of the mean shown. Statistical differences between vaccinated and nonvaccinated subjects were determined by the non-parametric Kruskal-Wallis (*, P < .05; **, P < .005).

