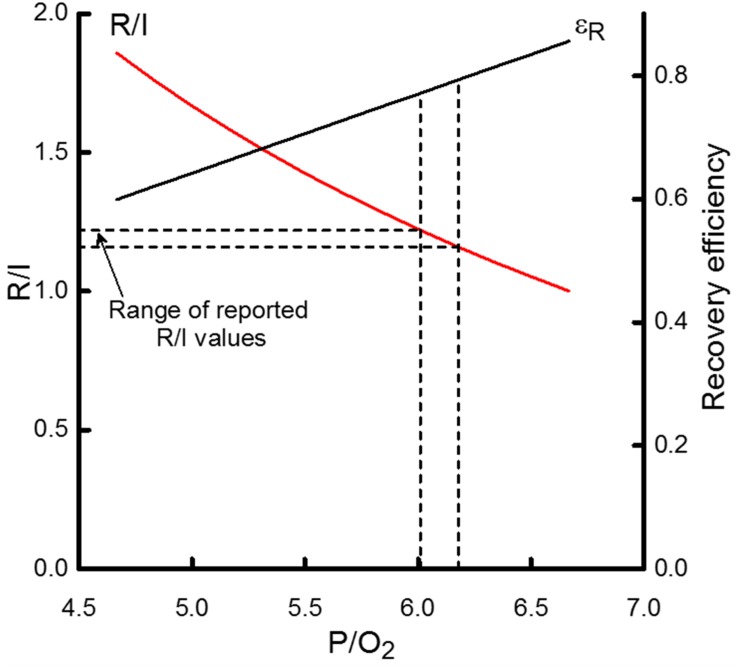
FIGURE 5.
The dependence on the P/O2 ratio of the ratio of recovery heat to initial heat (R/I) and recovery efficiency (εR). R/I values are scaled by the left-hand y-axis and εR by the right-hand y- axis. The horizontal dashed lines indicate the range of reported R/I values for cardiac muscle; that range corresponds to P/O2 values from approximately 6 to 6.2, indicated by the vertical dashed lines. That range of P/O2 values, in turn, is consistent with εR values of 0.77 to 0.79, as indicated by the intersection of the vertical dashed lines and the curve relating the P/O2 dependence of εR. If ATP yield were approximately 30 ATP/glucose, then P/O2 would be 5 which would correspond to R/I and εR values of 1.7 and 0.64, respectively.

