Figure 3.
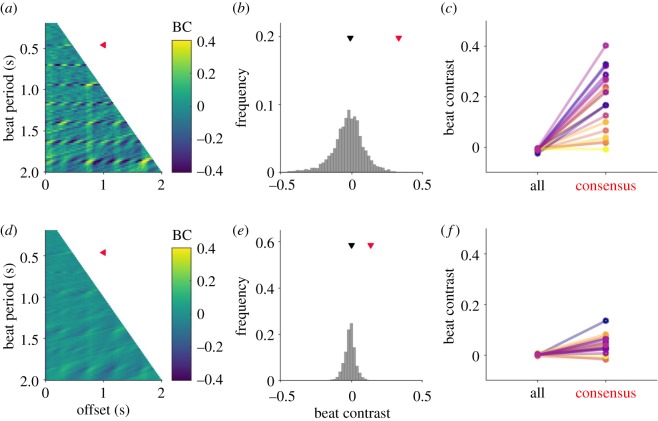
High beat contrast distinguishes the perceived beat from other possible beat interpretations. (a) Heatmap depicting auditory cortical beat contrasts for possible beat period (y-axis) and phase offset (x-axis) combinations between 200 ms and 2 s (beat rates of 5 Hz to 0.5 Hz) for an example musical excerpt. Red triangle indicates the consensus beat period. (b) Histogram of BC values in panel (a). The consensus BC (red triangle) is larger than the median of all BCs (black triangle). (c) Comparison of the each excerpt's median cortical BC (left) with its consensus BC (right). Coloured lines are excerpts 1–20, ordered from dark to light. (d–f) Same as panels (a–c), but based on AN model responses.

