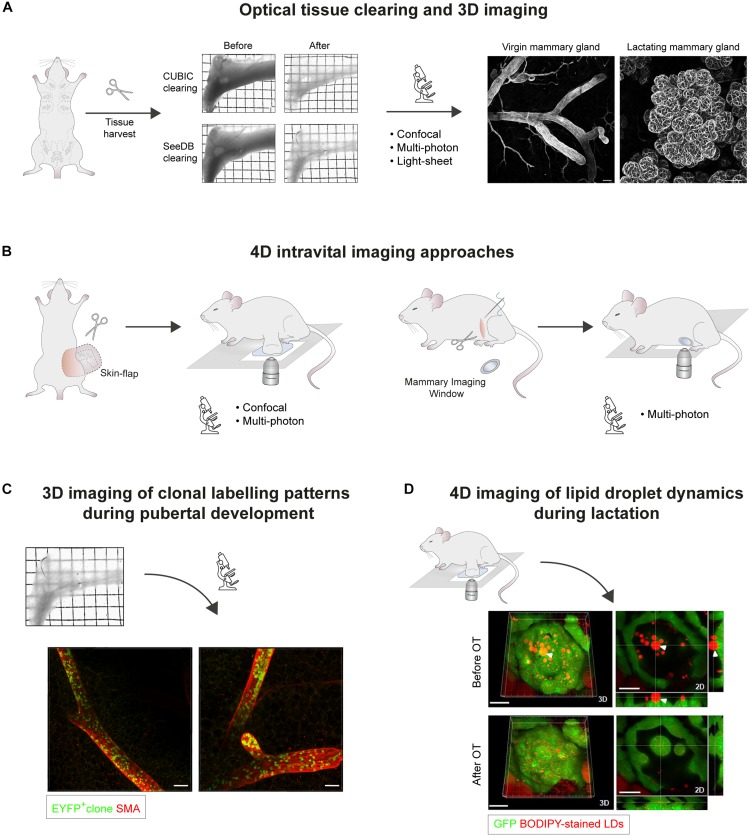
FIGURE 1.
Microscopic 3D and 4D imaging of mammary gland ductal development and lactation. (A) Optical tissue clearing and 3D imaging of fixed mammary tissues. Transmission images of harvested abdominal mammary glands before and after tissue clearing using CUBIC or SeeDB protocols. Grid width: 2 mm. 3D confocal imaging of mammary epithelial structures immunostained for Smooth Muscle Actin (SMA) in cleared virgin and lactating mammary tissues. Scale bars, 100 μm. (B) 4D intravital imaging approaches. Intravital microscopy can be performed either by surgically exposing the tissue via a skin-flap incision for multiple hours (non-recovery imaging, <40 h), or by implanting optical imaging windows for longitudinal imaging spanning multiple days to weeks. While confocal microscopy is suitable for imaging superficial tissue regions, multiphoton excitation is required for deep-tissue imaging, particularly through mammary imaging windows. (C) Clonal patterns arising from the genetic labeling of a single EYFP+ epithelial cell in the mammary gland of a ∼7 week old R26[CA]30EYFP mouse. SeeDB tissue clearing and immunostaining were performed prior to 3D imaging by confocal microscopy. Labeled progeny span multiple ducts and branches, and exhibit a sporadic, interspersed labeling pattern, emphasizing the importance of performing whole-gland and/or deep tissue 3D imaging for accurate clonal analysis. These patterns likely arise from the proliferation and intermixing of both labeled and unlabeled terminal end bud (TEB)-resident precursors, which have equipotent potential to contribute to ductal elongation. Scale bars, 100 μm. (D) Confocal intravital imaging of fluorescent BODIPY-stained lipid droplets (LDs) in surgically-exposed lactating mammary glands. Release of LDs from the apical surface is mediated by oxytocin (OT)-induced myoepithelial cell contractions. 3D images and 2D sections of the same alveolus before and after OT exposure are shown. White arrowhead points to an LD that was embedded in the cytoplasm prior to alveolus contraction. Scale bars, 30 μm. Images in (A,C) adapted from Davis et al. (2016) Nature Communications, under https://creativecommons.org/licenses/by/4.0/. Images in (D) adapted from Masedunskas et al. (2017) Mol Biol Cell, under https://creativecommons.org/licenses/by-nc-sa/3.0/.

